AMO/OMA Map the Enduring Power of Diagrams at Fondazione Prada in Venice
Words by Eric David
Location
Venice, Italy
AMO/OMA Map the Enduring Power of Diagrams at Fondazione Prada in Venice
Words by Eric David
Venice, Italy
Venice, Italy
Location
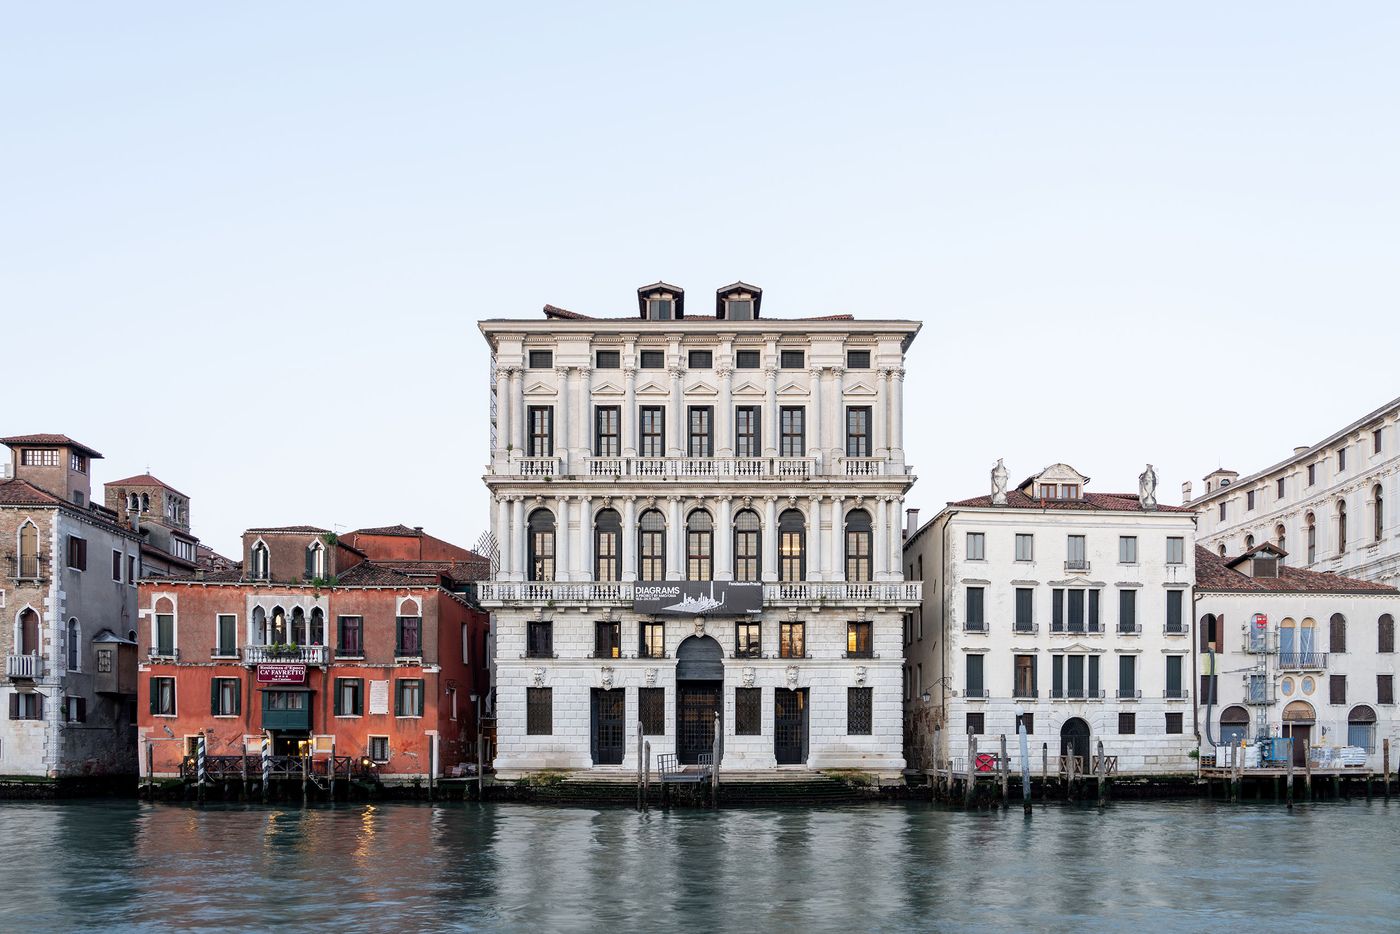
Amid the flood of architectural ideas swirling around the 2025 Venice Architecture Biennale, an eddy of visual lucidity has formed just off the Grand Canal. From May 10 to November 24, Fondazione Prada’s Venetian outpost is hosting “Diagrams”, an expansive, probing, and frankly mesmerizing exhibition conceived by AMO/OMA, Rem Koolhaas’ illustrious architectural practice and think-tank arm.
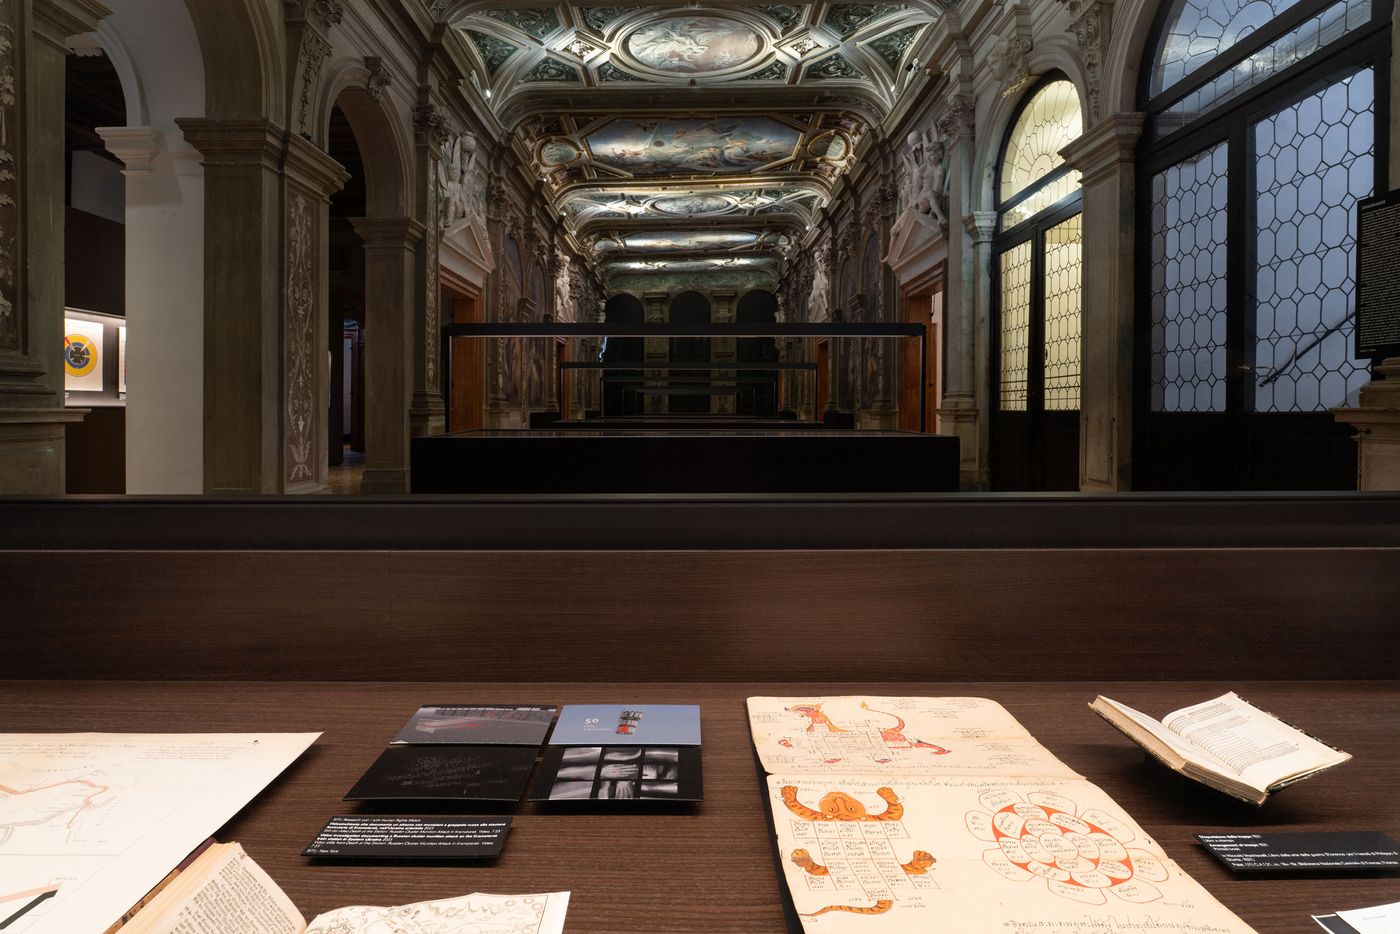
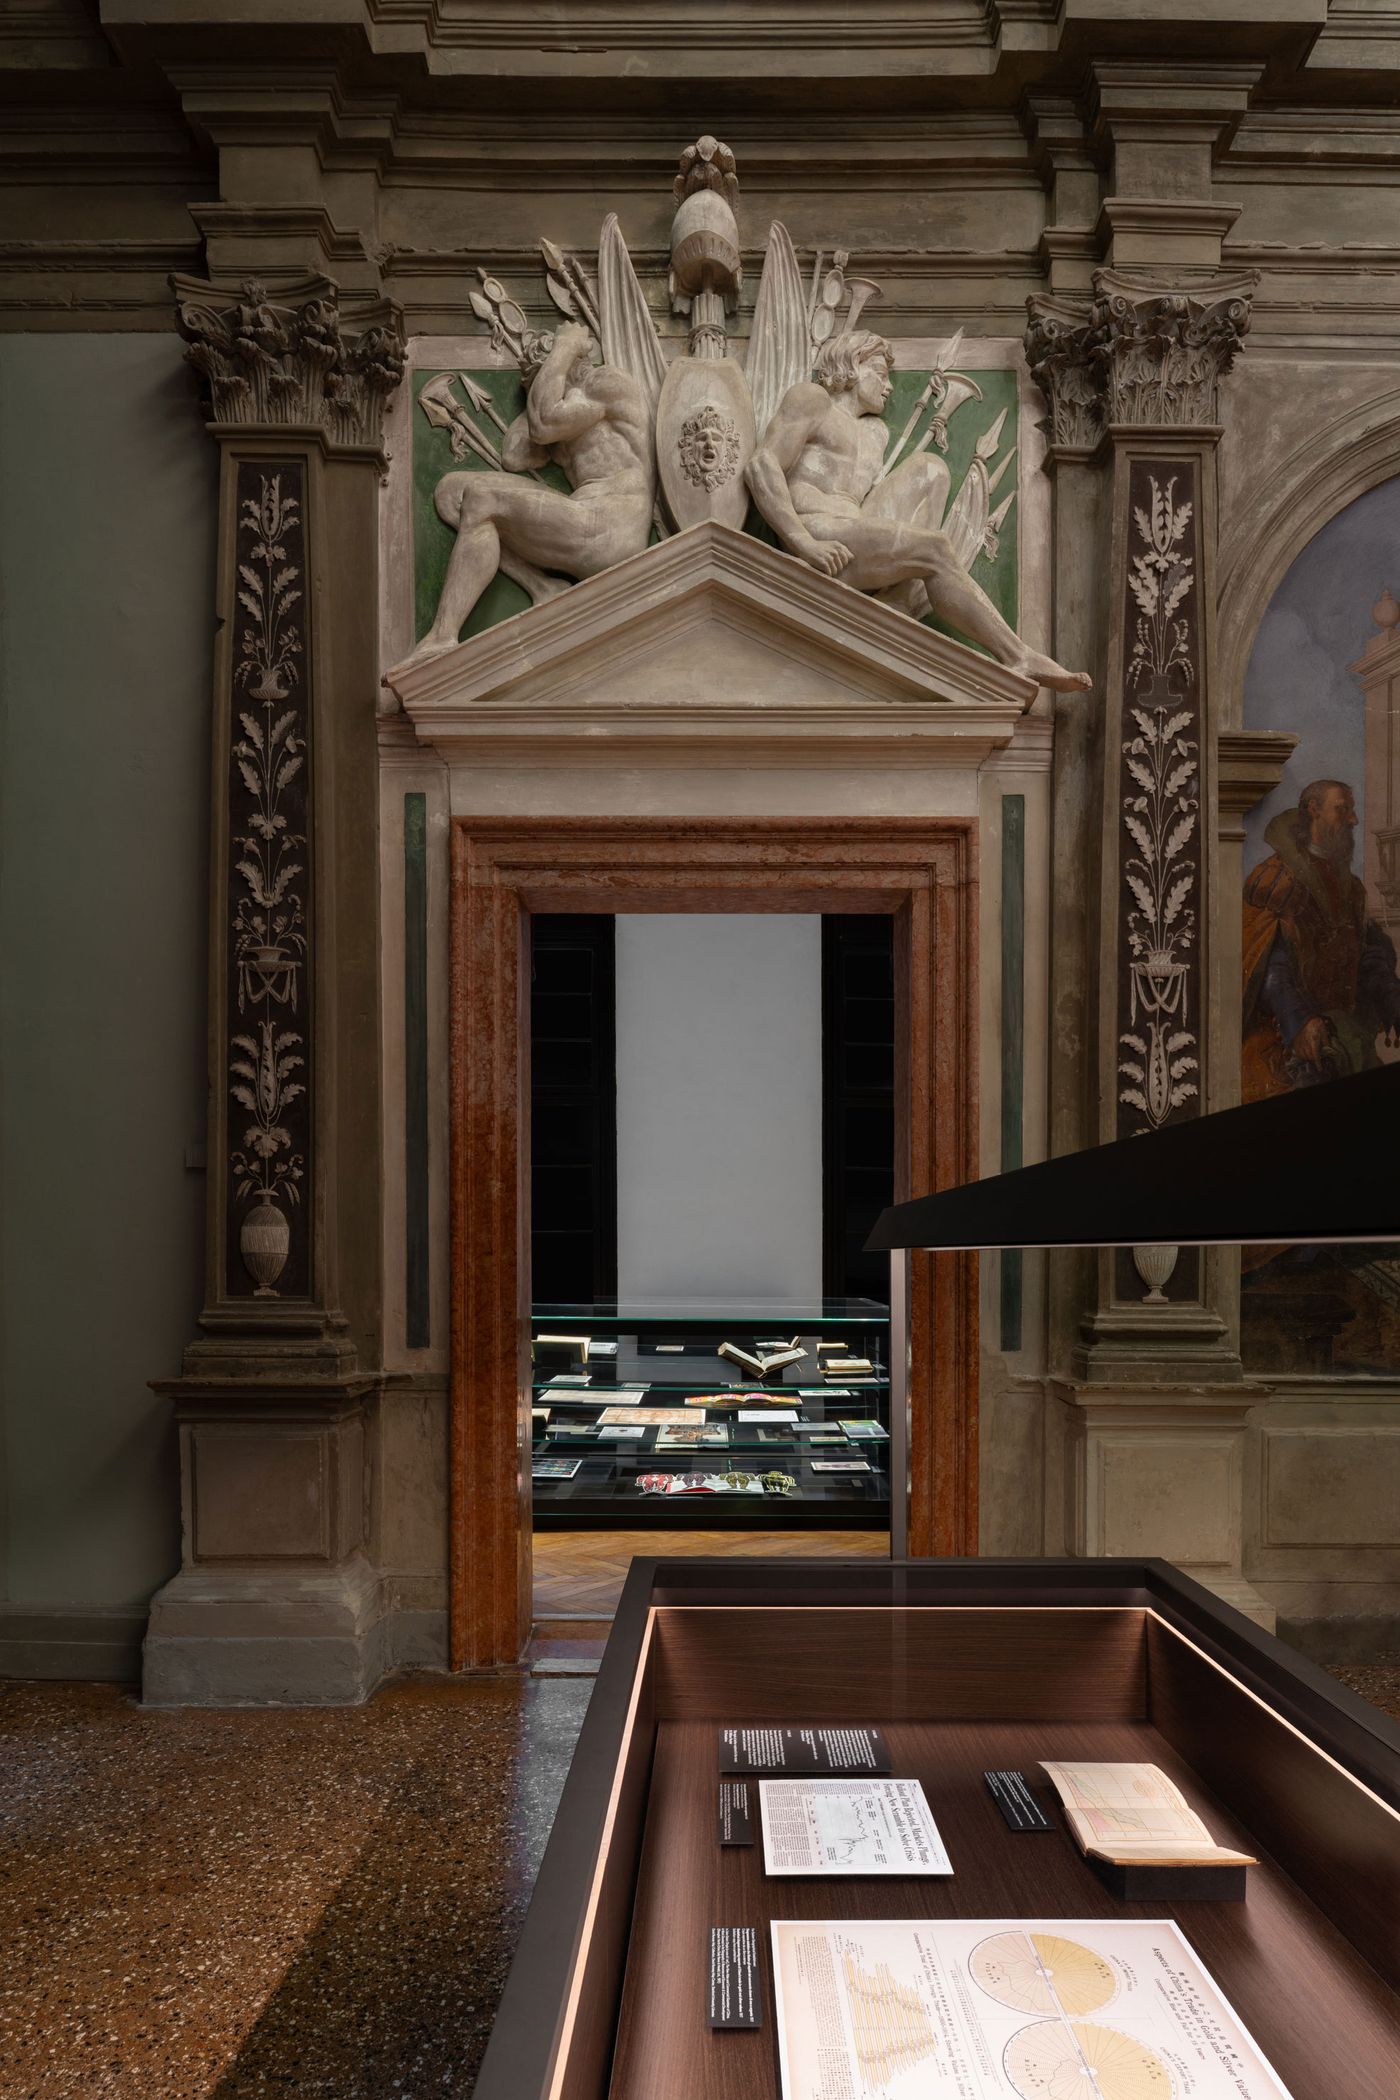
Housed in the 18th-century Ca’ Corner della Regina—a palazzo whose own history traces shifting maps of political, religious, and cultural power—"Diagrams” brings together over 300 artifacts charting a lineage of visual intelligence that spans from the 12th century to today. Rare manuscripts, publications, maps, digital visuals, and film have been deployed in service of a question that feels both immediate and eternal: how do we visually communicate knowledge? A love letter to diagrams in all their persuasive, deceitful, poetic, and democratic glory, the exhibition also acts as a conceptual counterweight to the Architectural Biennale, examining the foundational structures of thought that often precede form.
Exhibition view of “Diagrams: A Project by AMO/OMA”, Fondazione Prada, Venice. Photography by Marco Cappelletti. Courtesy: Fondazione Prada.
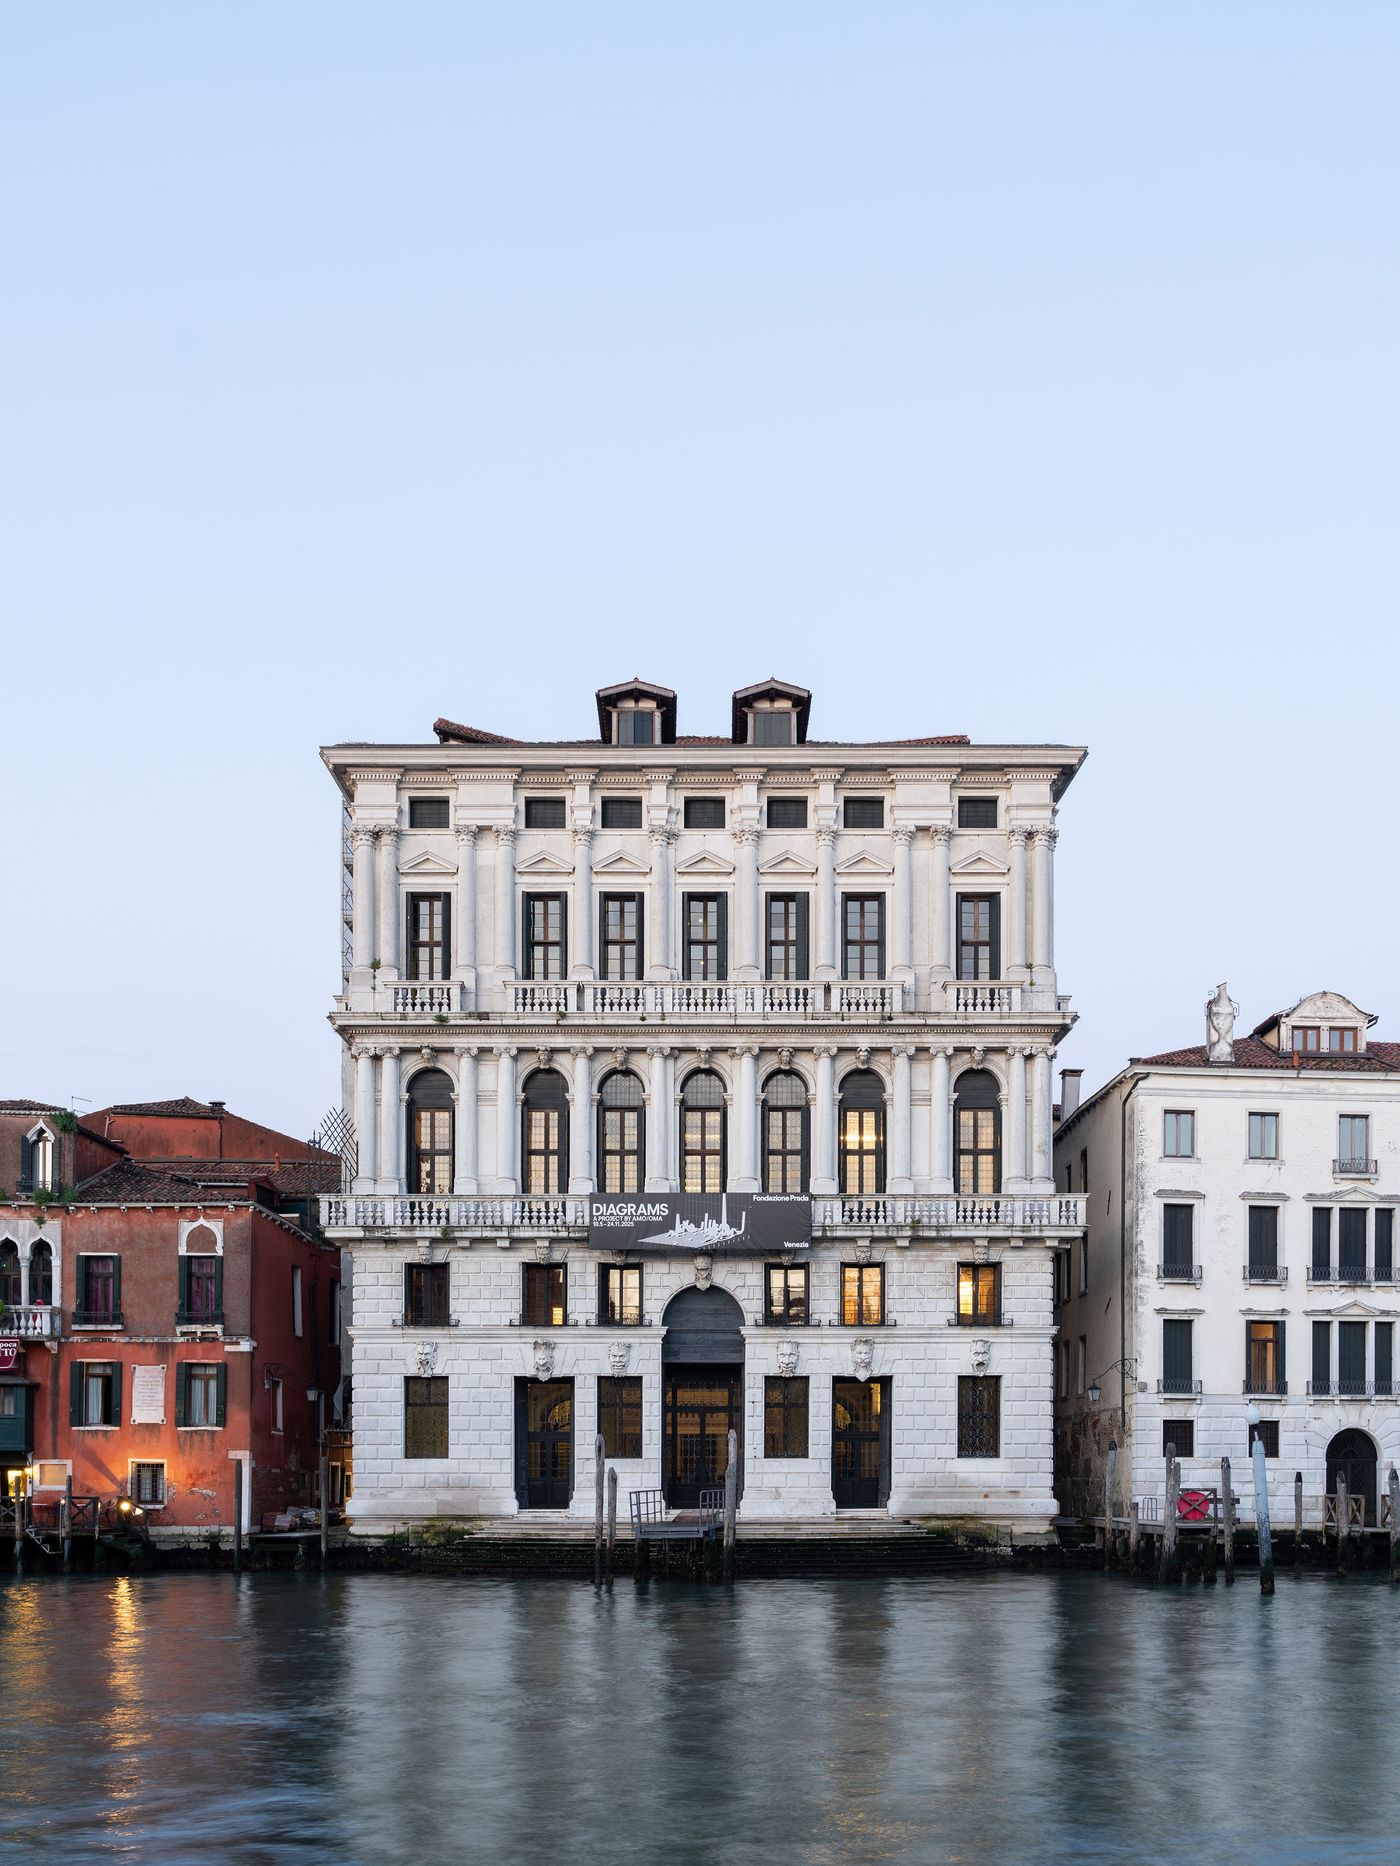
Exhibition view of “Diagrams: A Project by AMO/OMA”, Fondazione Prada, Venice. Photography by Marco Cappelletti. Courtesy: Fondazione Prada.
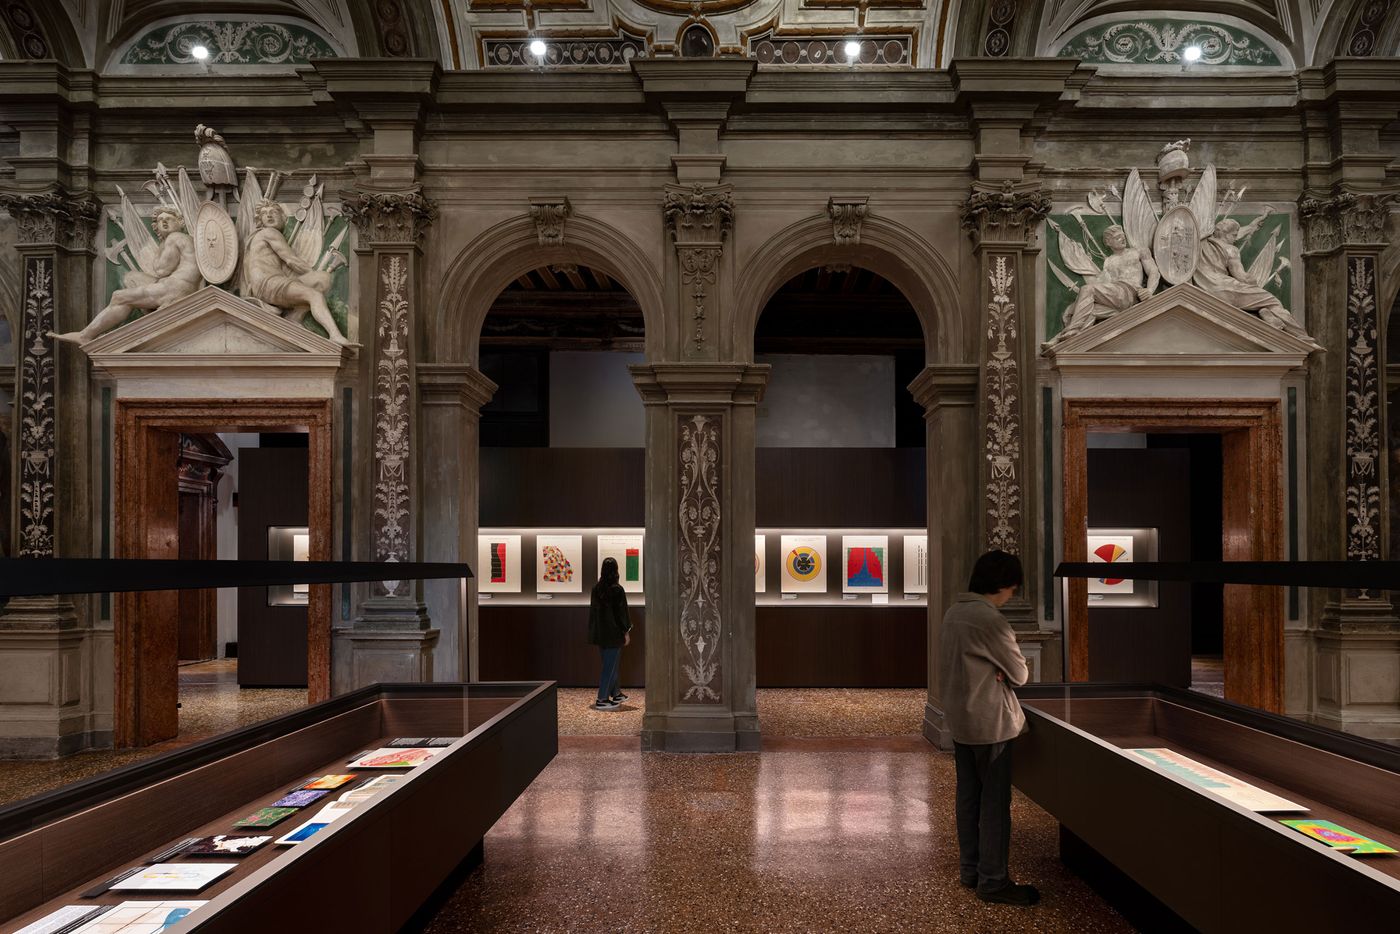
Exhibition view of “Diagrams: A Project by AMO/OMA”, Fondazione Prada, Venice. Photography by Marco Cappelletti. Courtesy: Fondazione Prada.
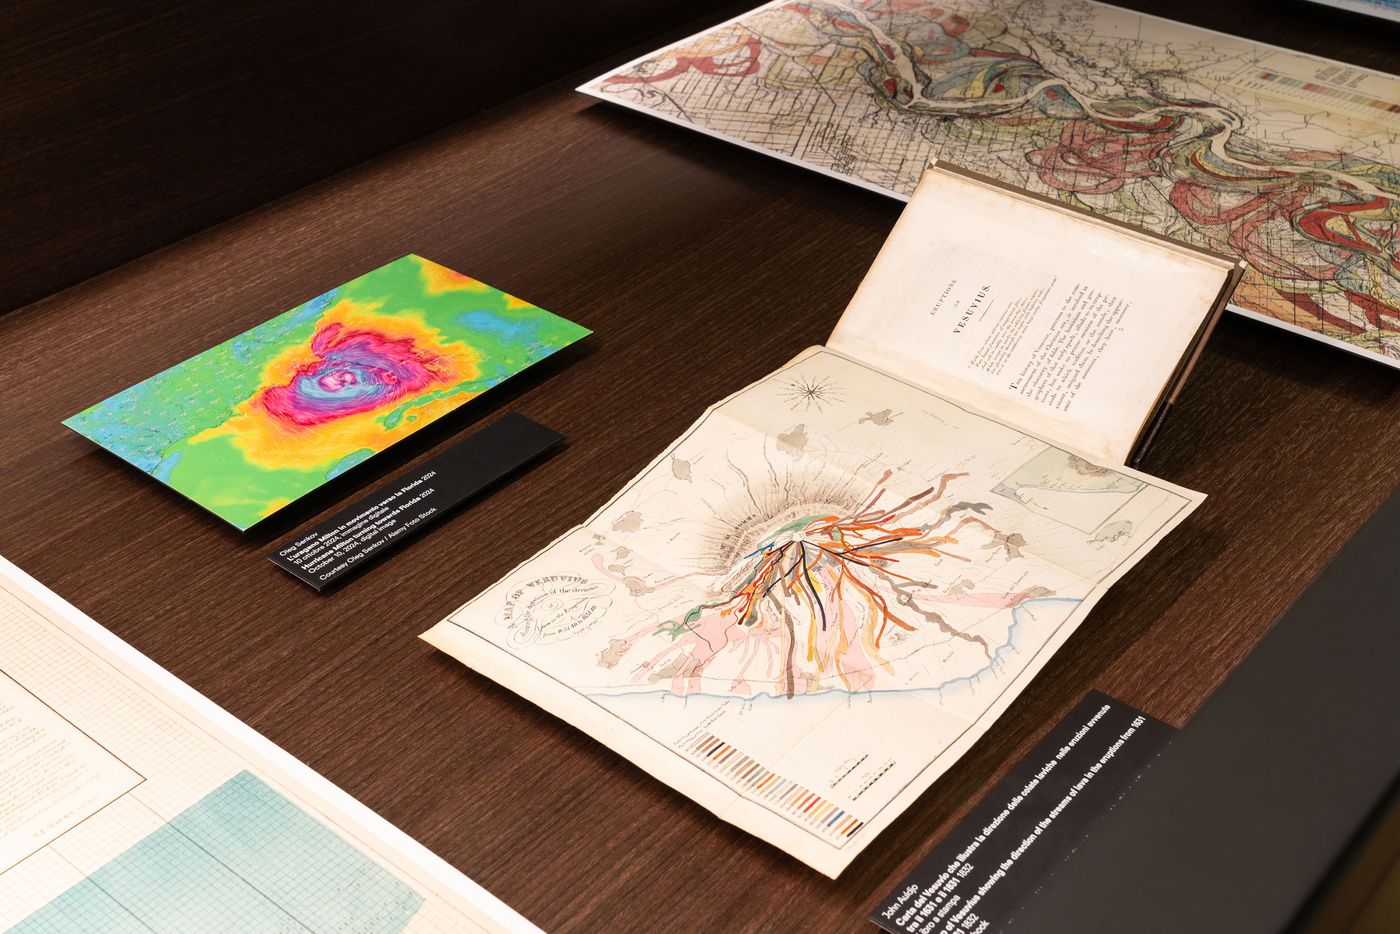
Exhibition view of “Diagrams: A Project by AMO/OMA”, Fondazione Prada, Venice. Photography by Marco Cappelletti. Courtesy: Fondazione Prada.
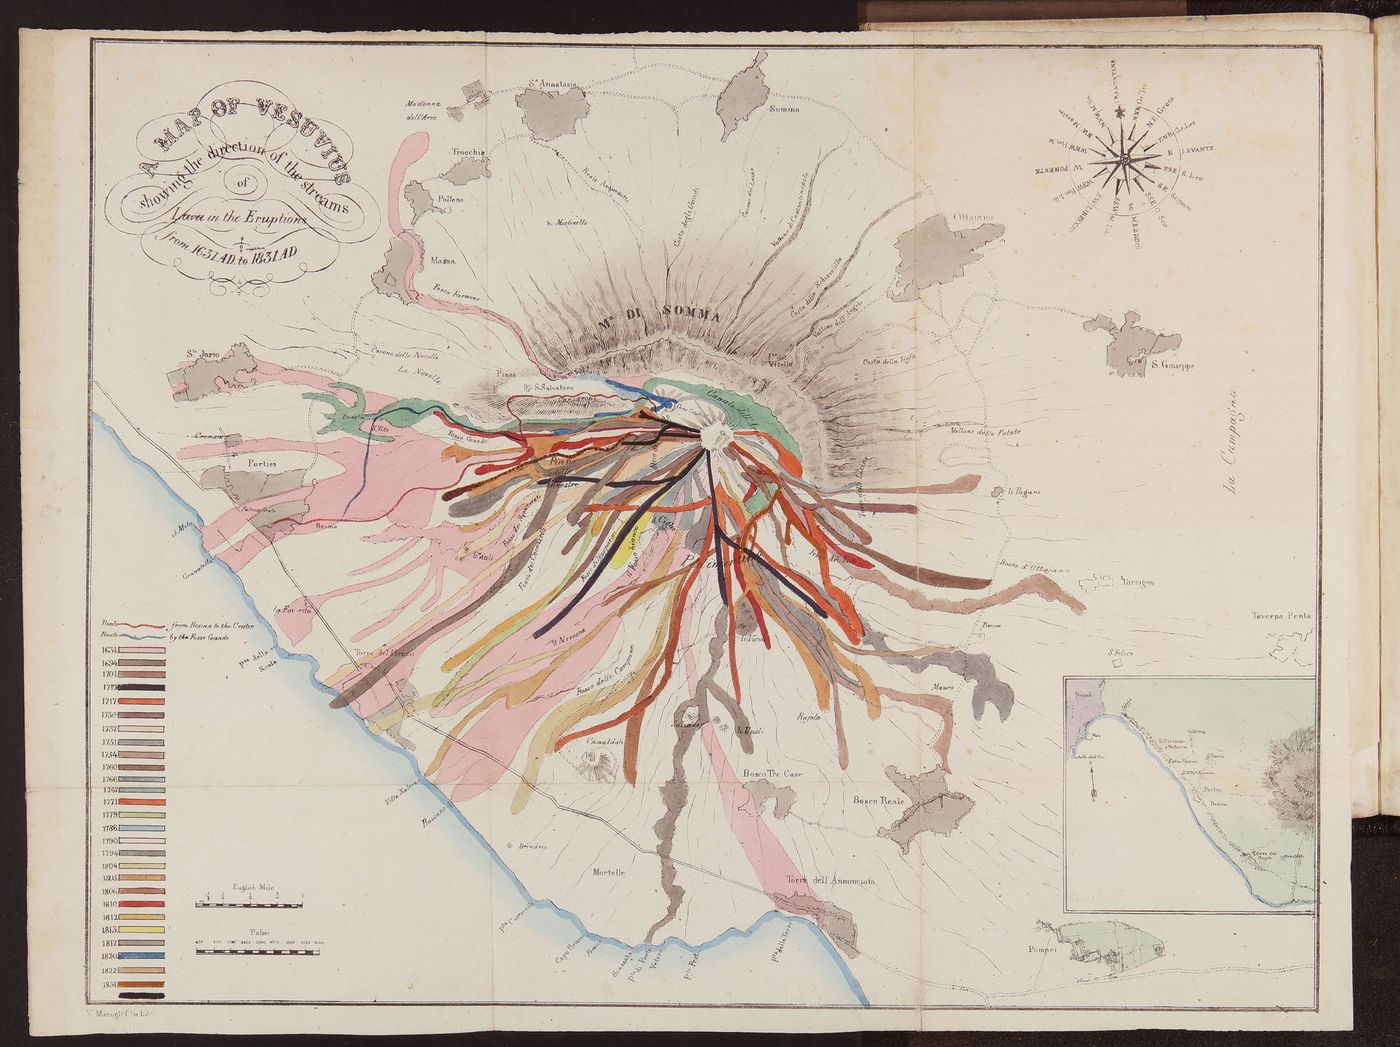
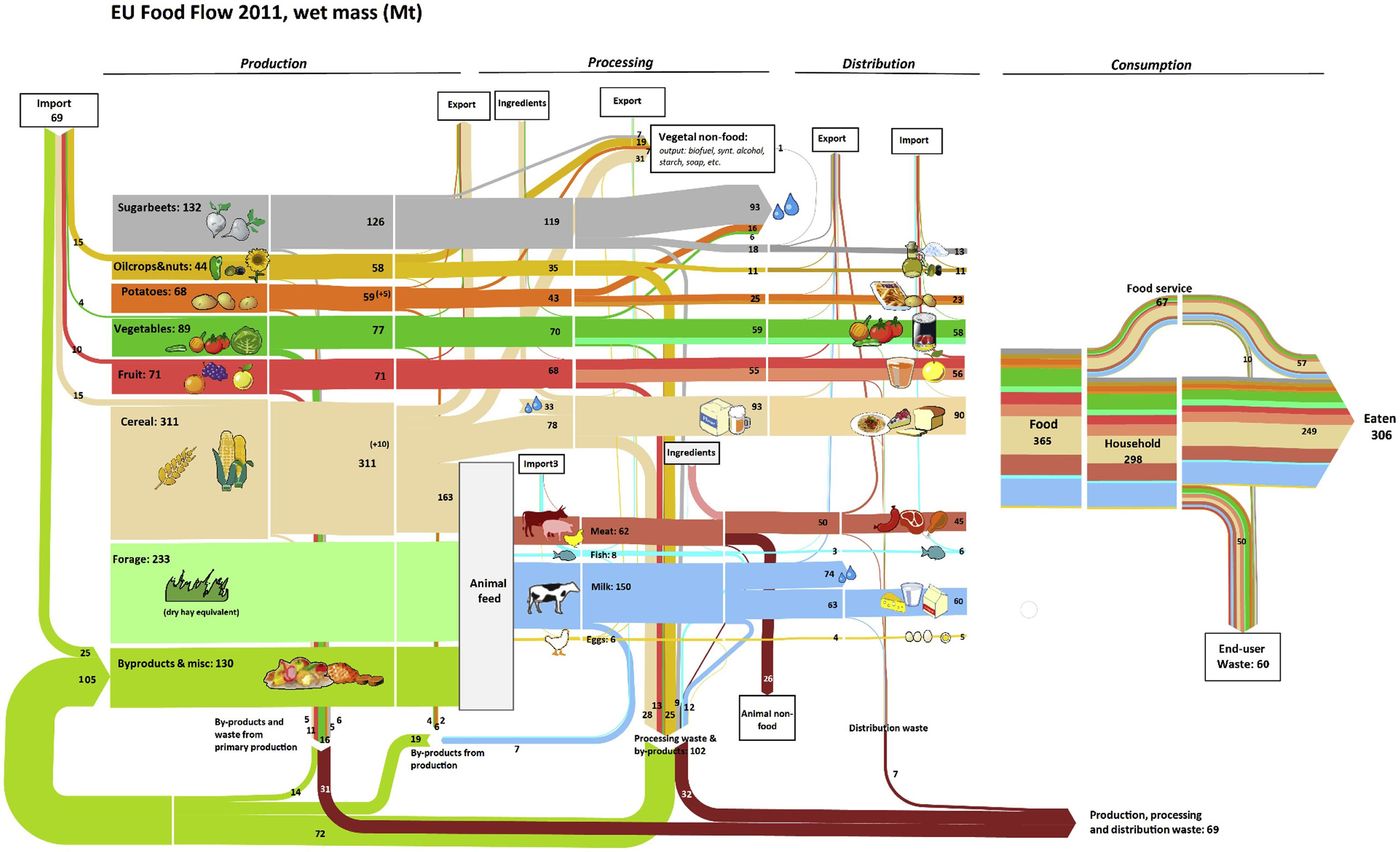
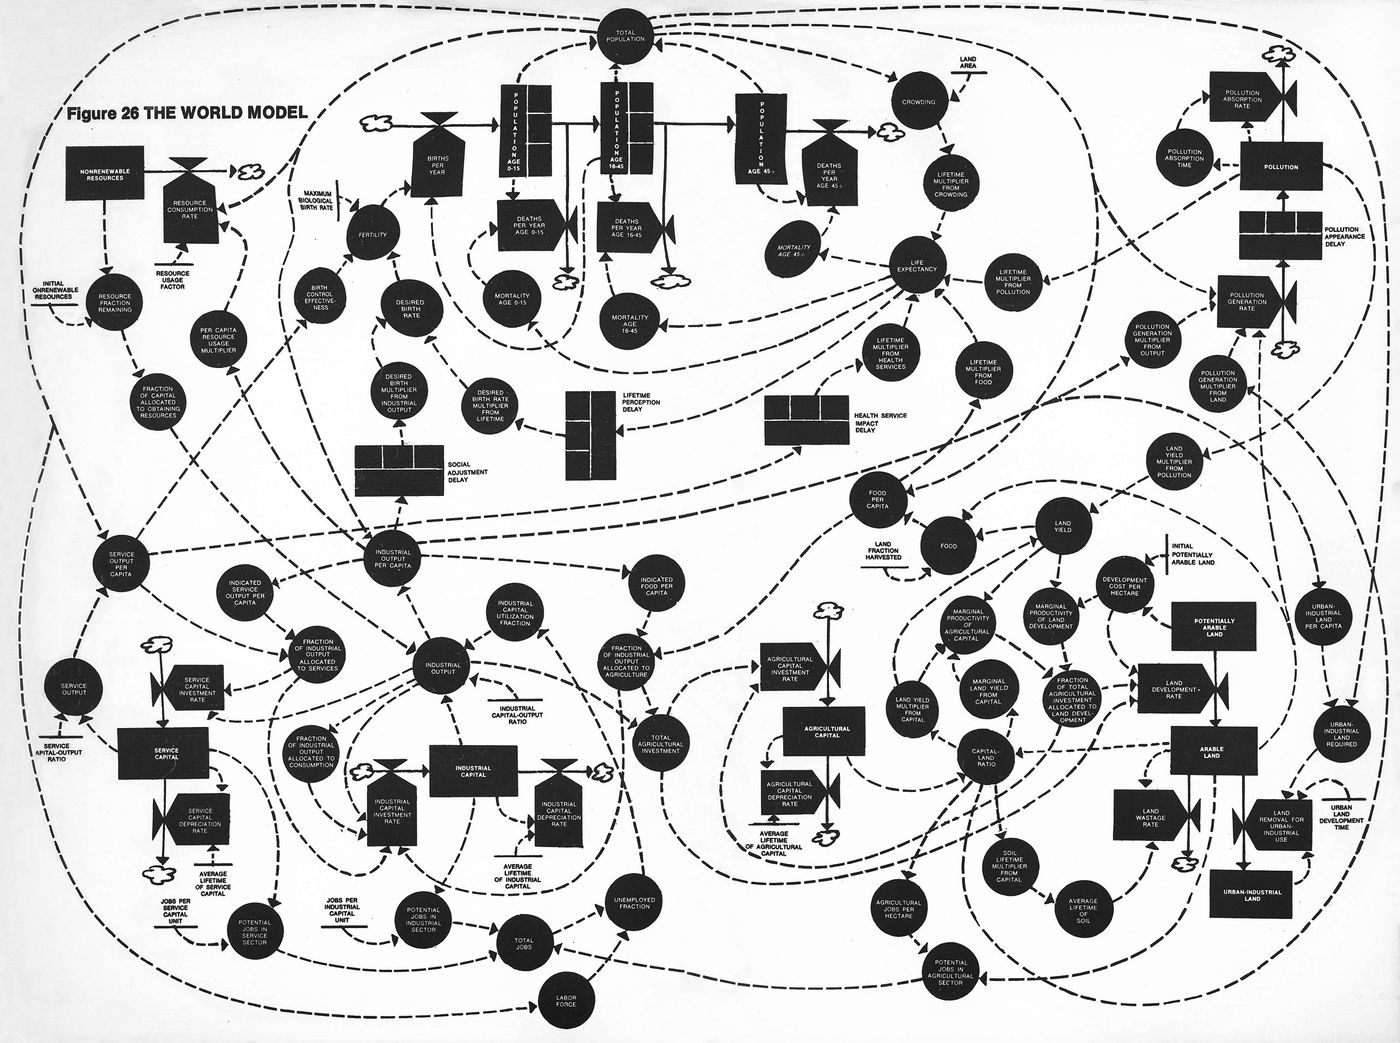
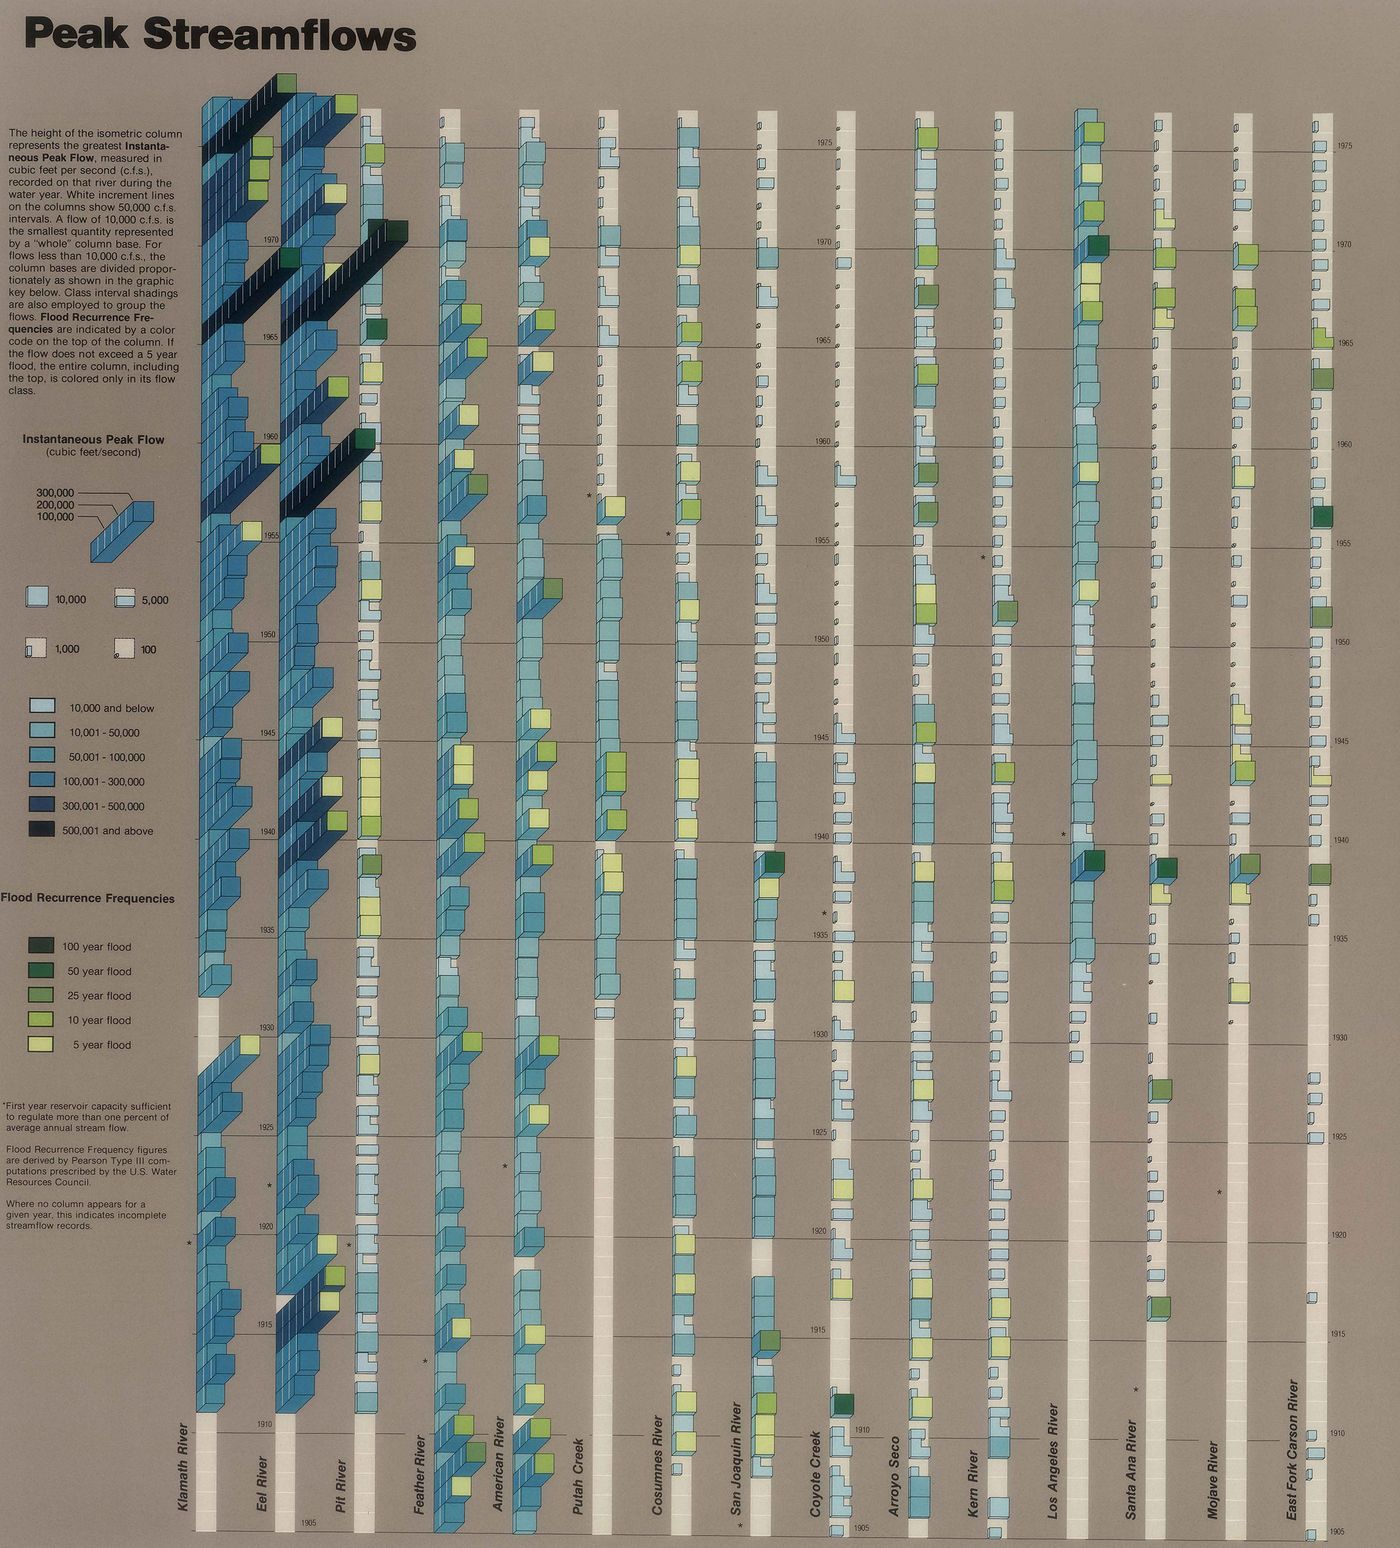
A diagram is many things—a tool, language, weapon, mirror. It may feign neutrality, with its neat vectors and clean geometries, but it is seldom innocent. Historically used to chart stars, plan cities, diagram battlefields or communicate medical data, the diagram is a vehicle for ideology as much as it is for information. “In my view, the diagram has been an almost permanent tool,” remarks Koolhaas. “It not only exists by default in any new medium but can also be applied to virtually any area of human life… its independence from language makes it one of the most effective forms of representation.”
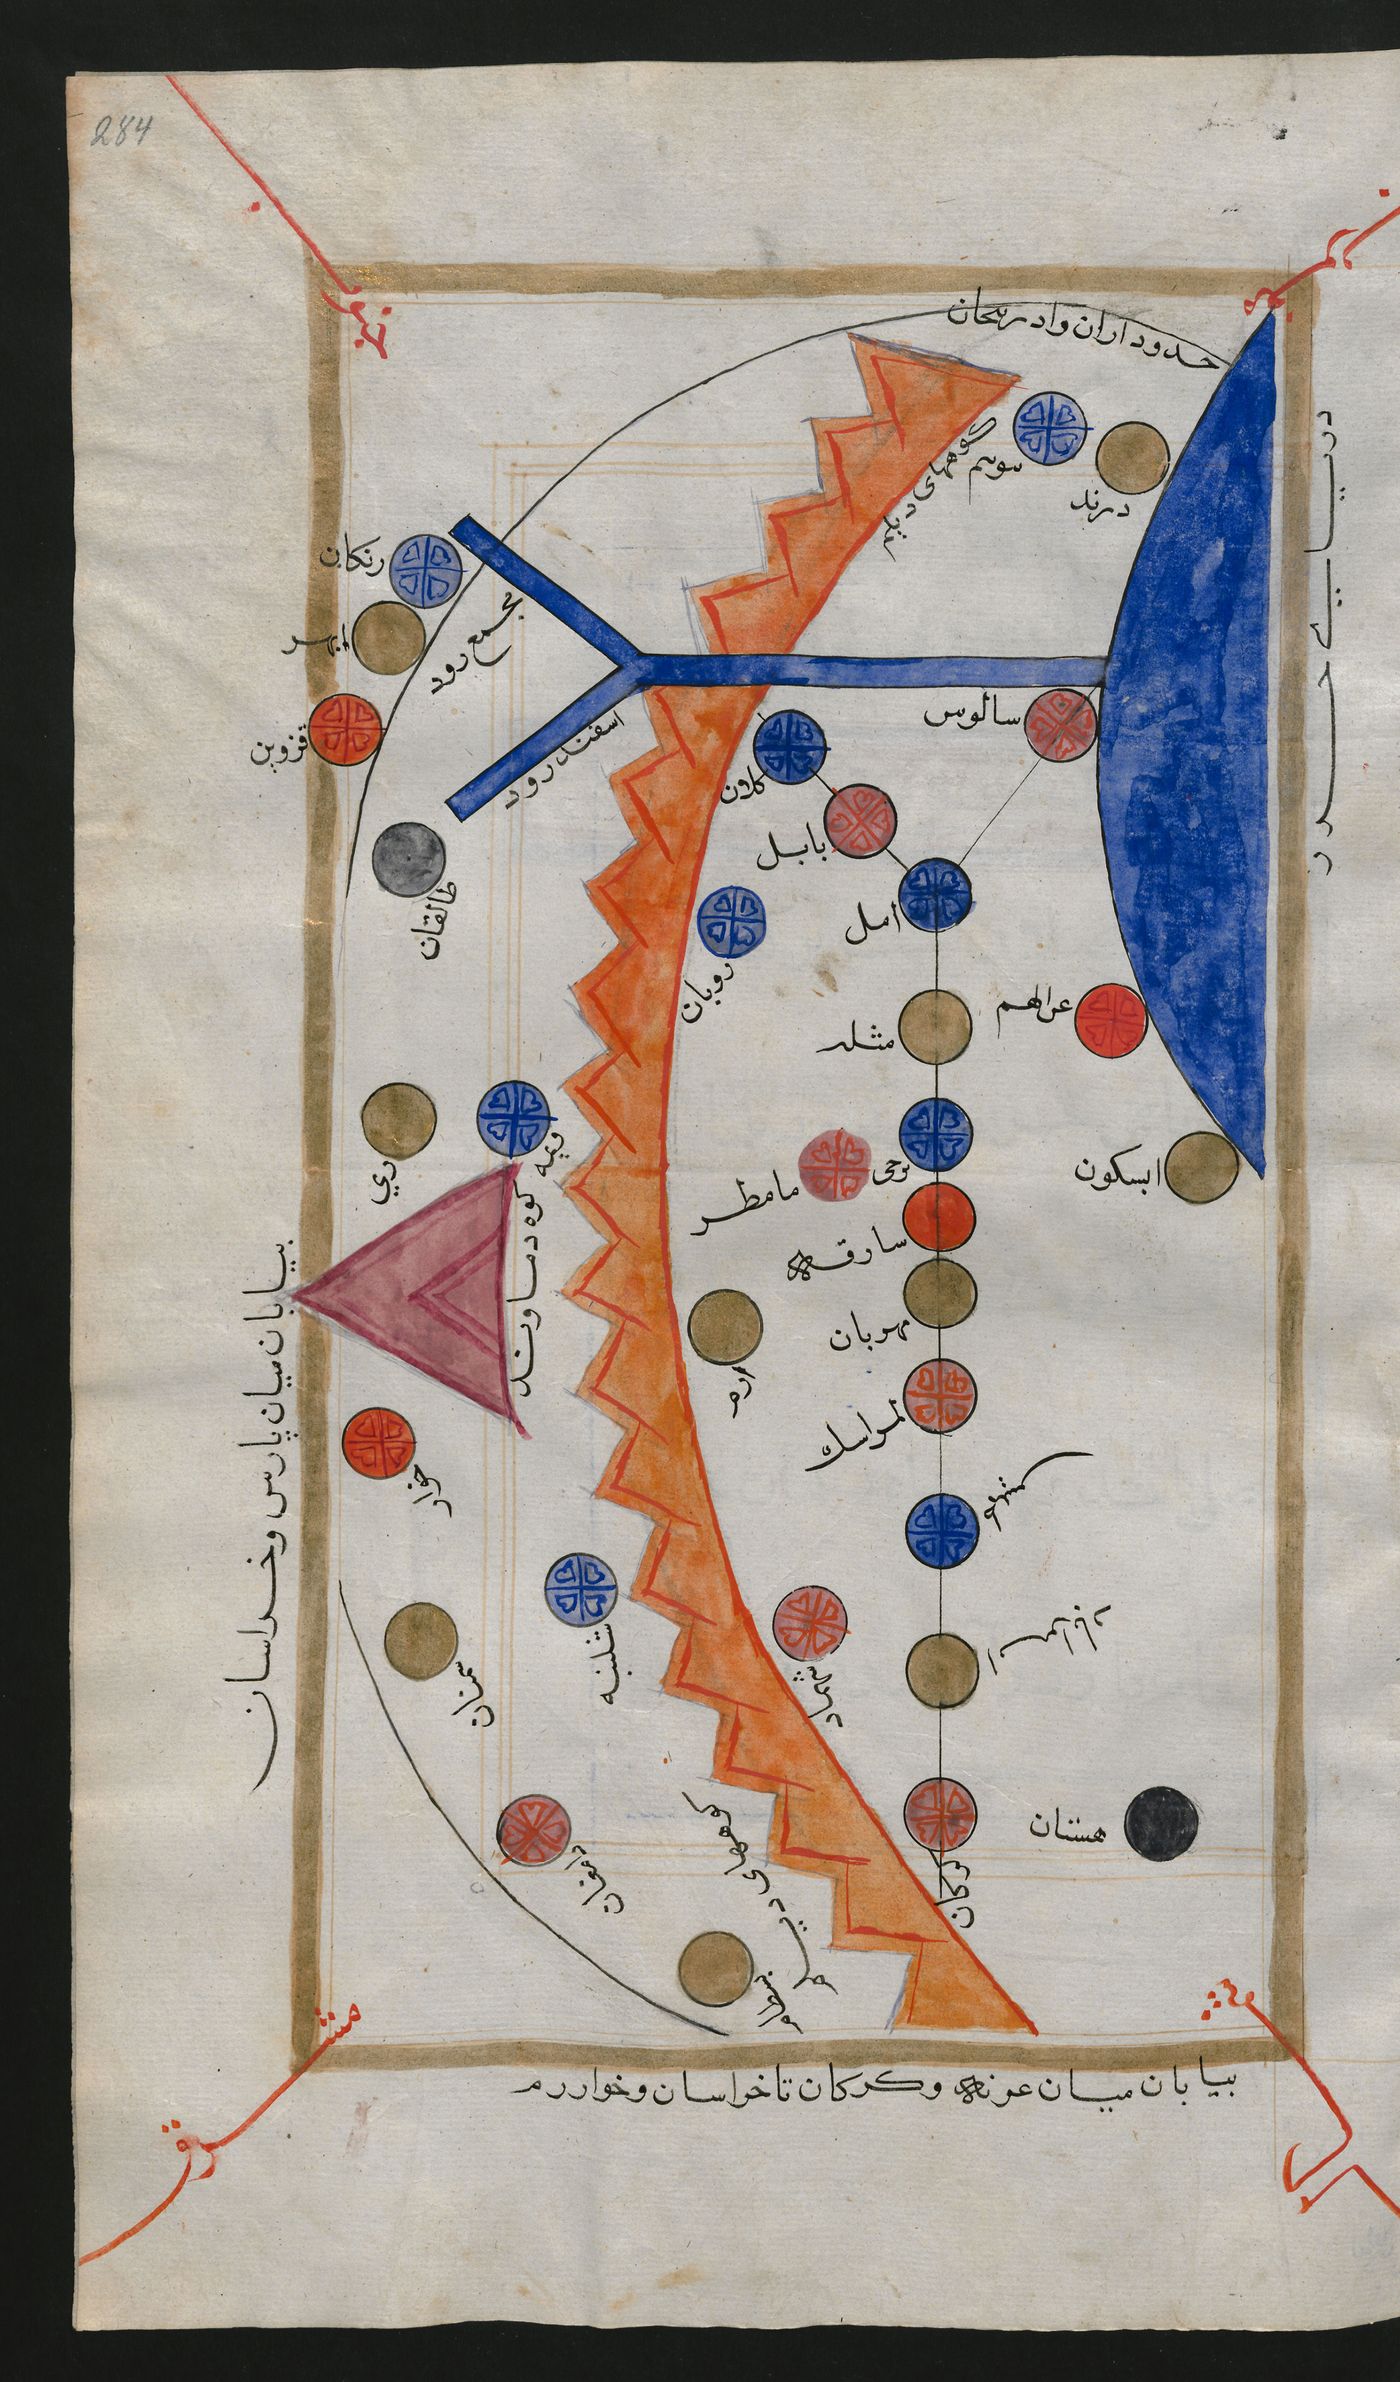
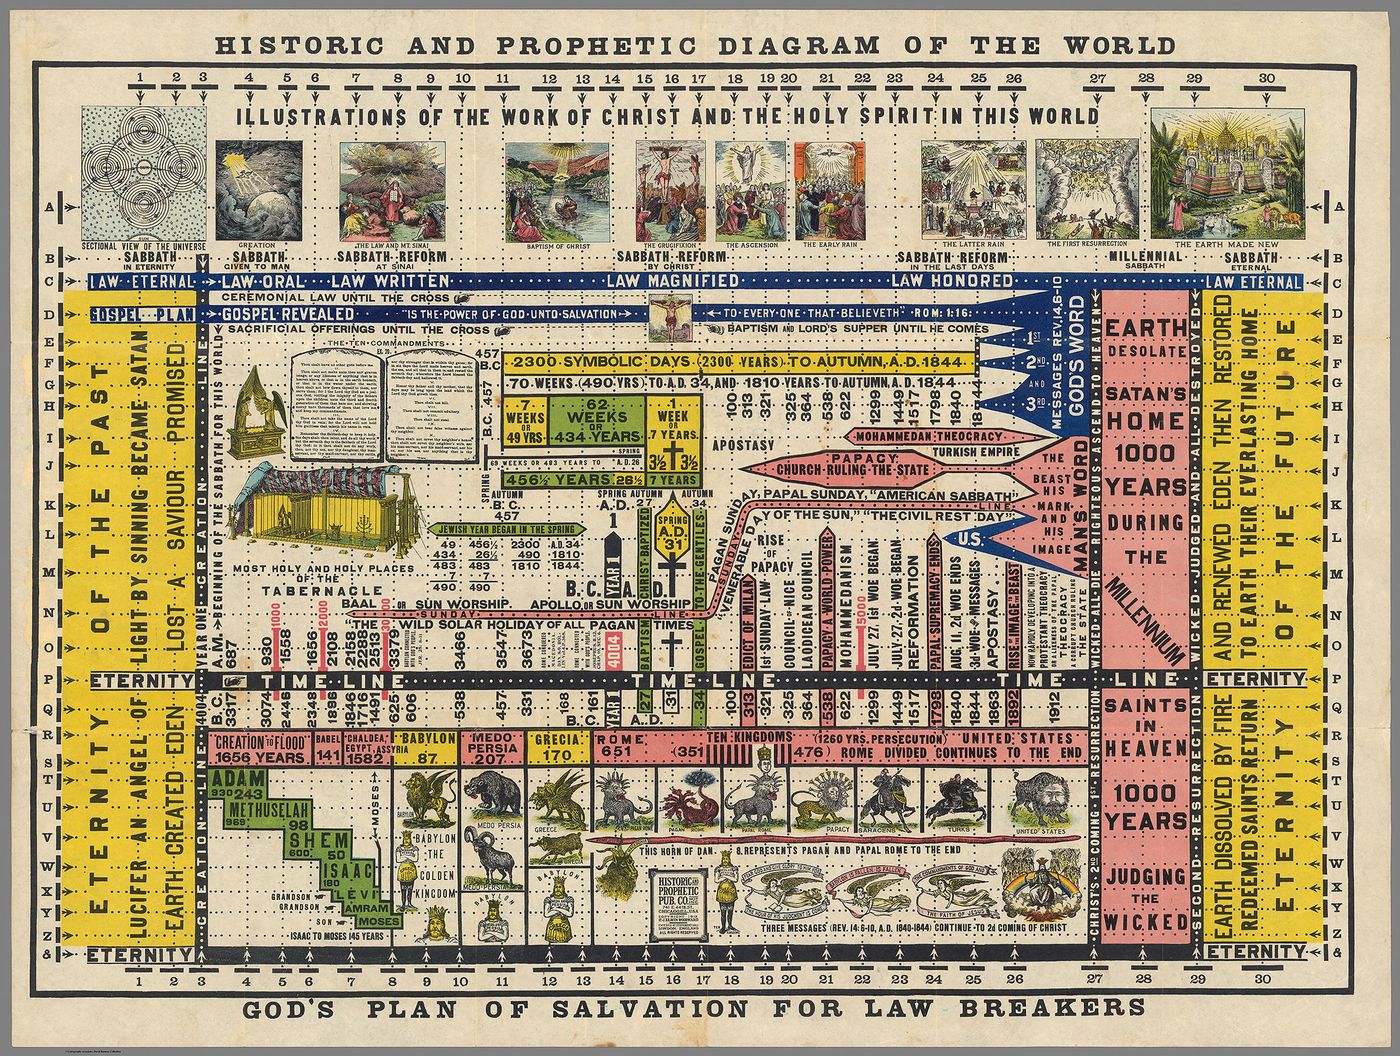
Indeed, diagrams are both cross-cultural and interdisciplinary. From Mesoamerican codices and Islamic astronomical charts to Alexander von Humboldt’s ecological matrices and Emma Willard’s 19th-century “maps of time,” these graphic structures have been enlisted to distil complexity—and, at times, to oversimplify it. And it is this this tension between clarity and distortion that holds pace as one of the exhibition’s central concerns.
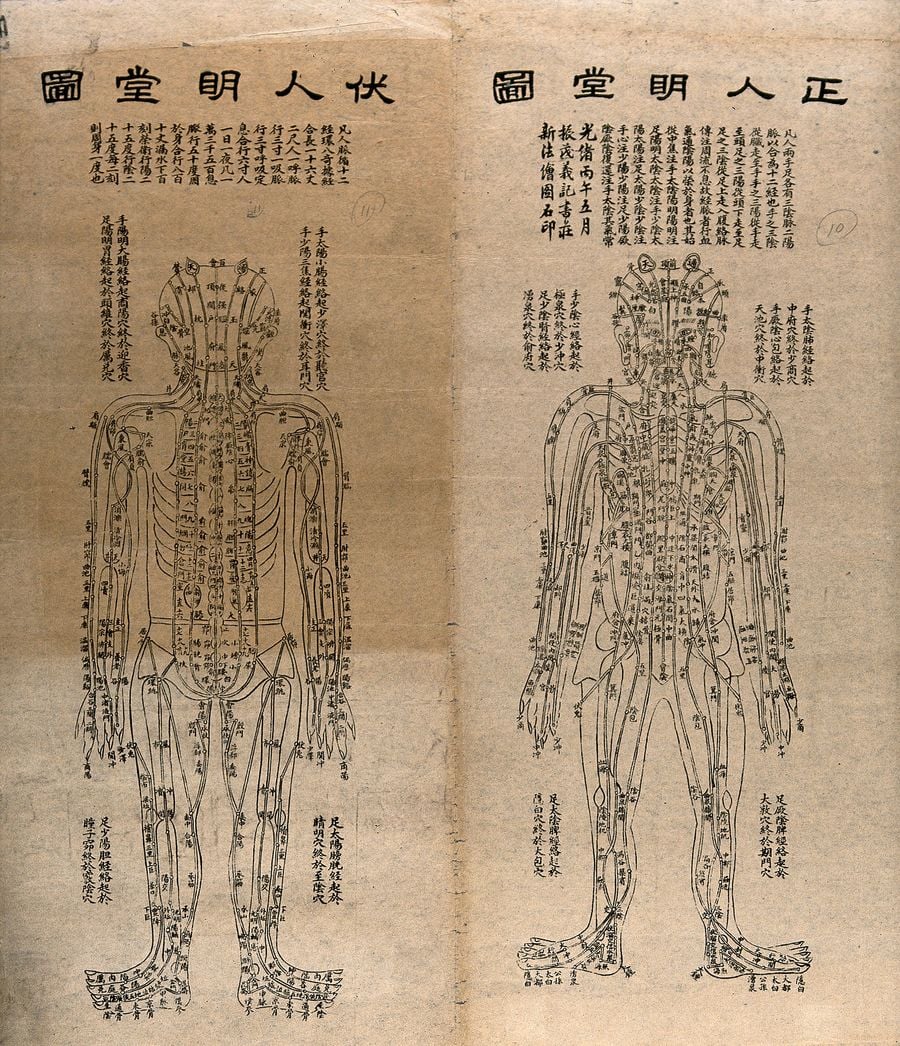
The human body, showing a circulatory system: front and back views, n.d. China, woodcut, exhibition copy. Wellcome Collection, London. Courtesy Wellcome Collection, London.
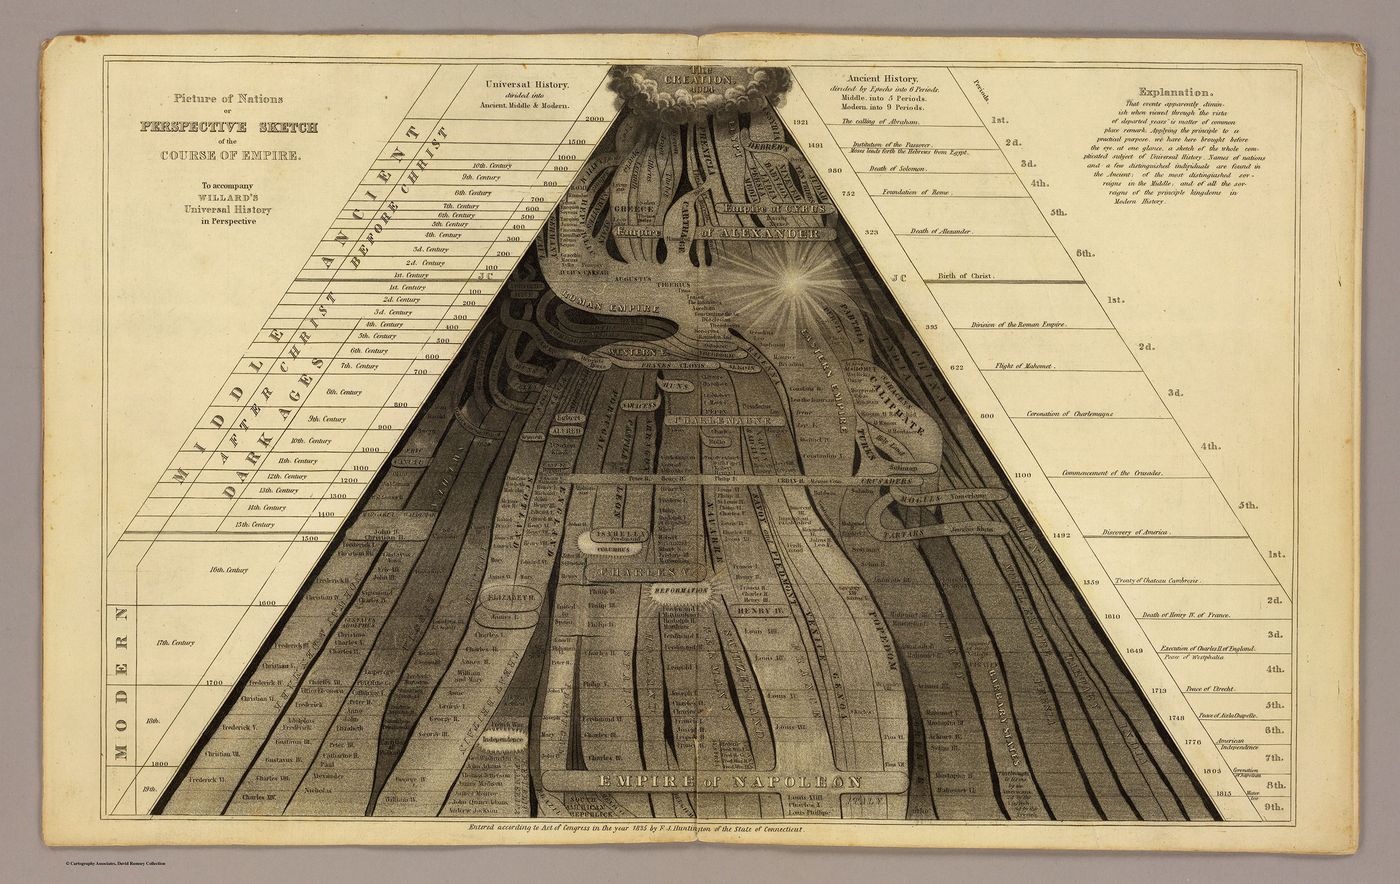
Perspective sketch of the universal history from the creation to the empire of Napoleon, 1836. Exhibition copy from a printed book. In Emma Willard, Universal History in Perspective (Hartford: F.J. Huntington, 1836). David Rumsey Map Collection, David Rumsey Map Center, Stanford University Libraries. Courtesy David Rumsey Map Collection, David Rumsey Map Center, Stanford University Libraries.
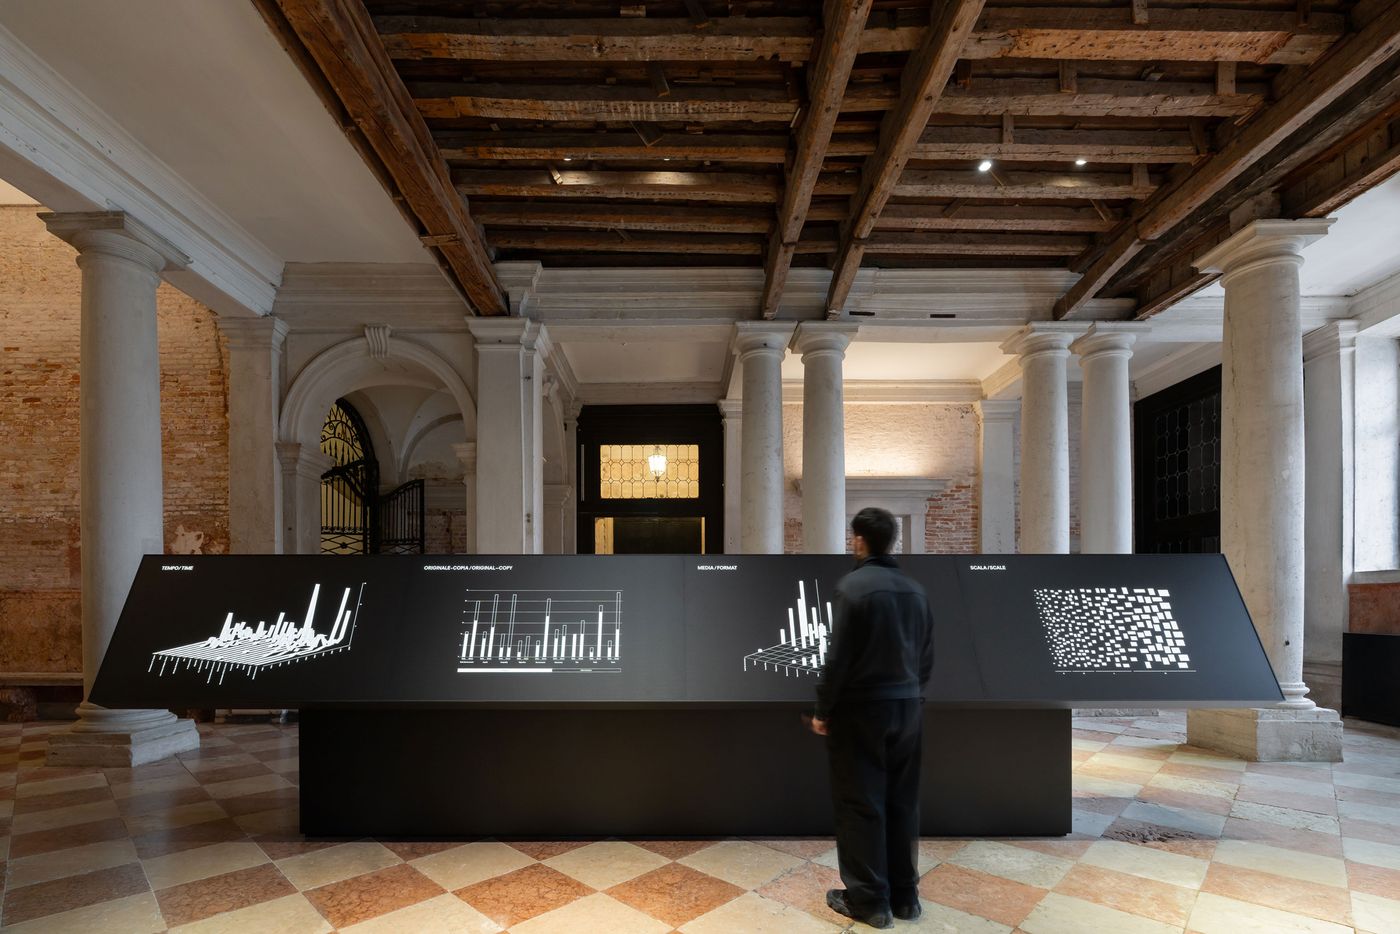
Exhibition view of “Diagrams: A Project by AMO/OMA”, Fondazione Prada, Venice. Photography by Marco Cappelletti. Courtesy: Fondazione Prada.
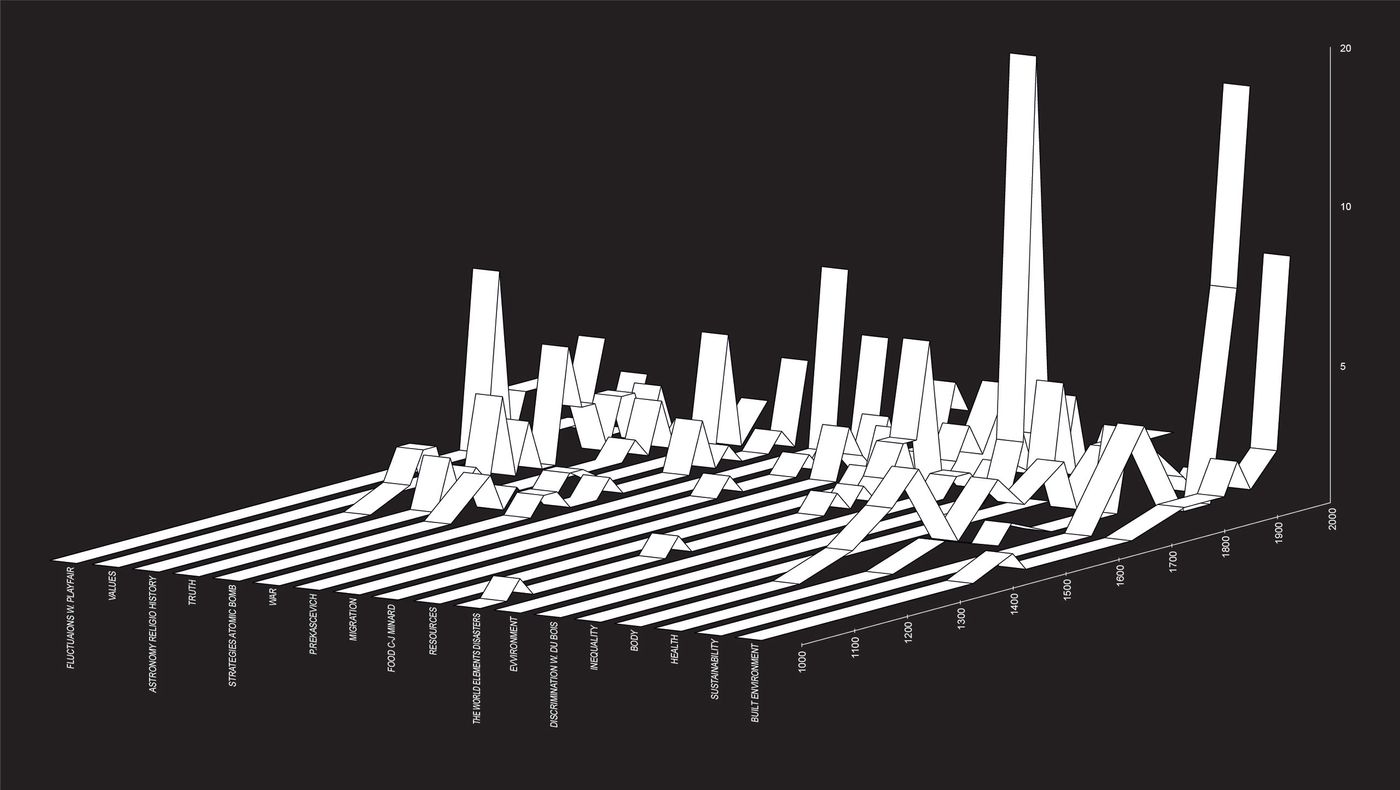
AMO/OMA. Timeline, 2025. Courtesy AMO/OMA. Distribution of diagrams on display by topic and year of production.
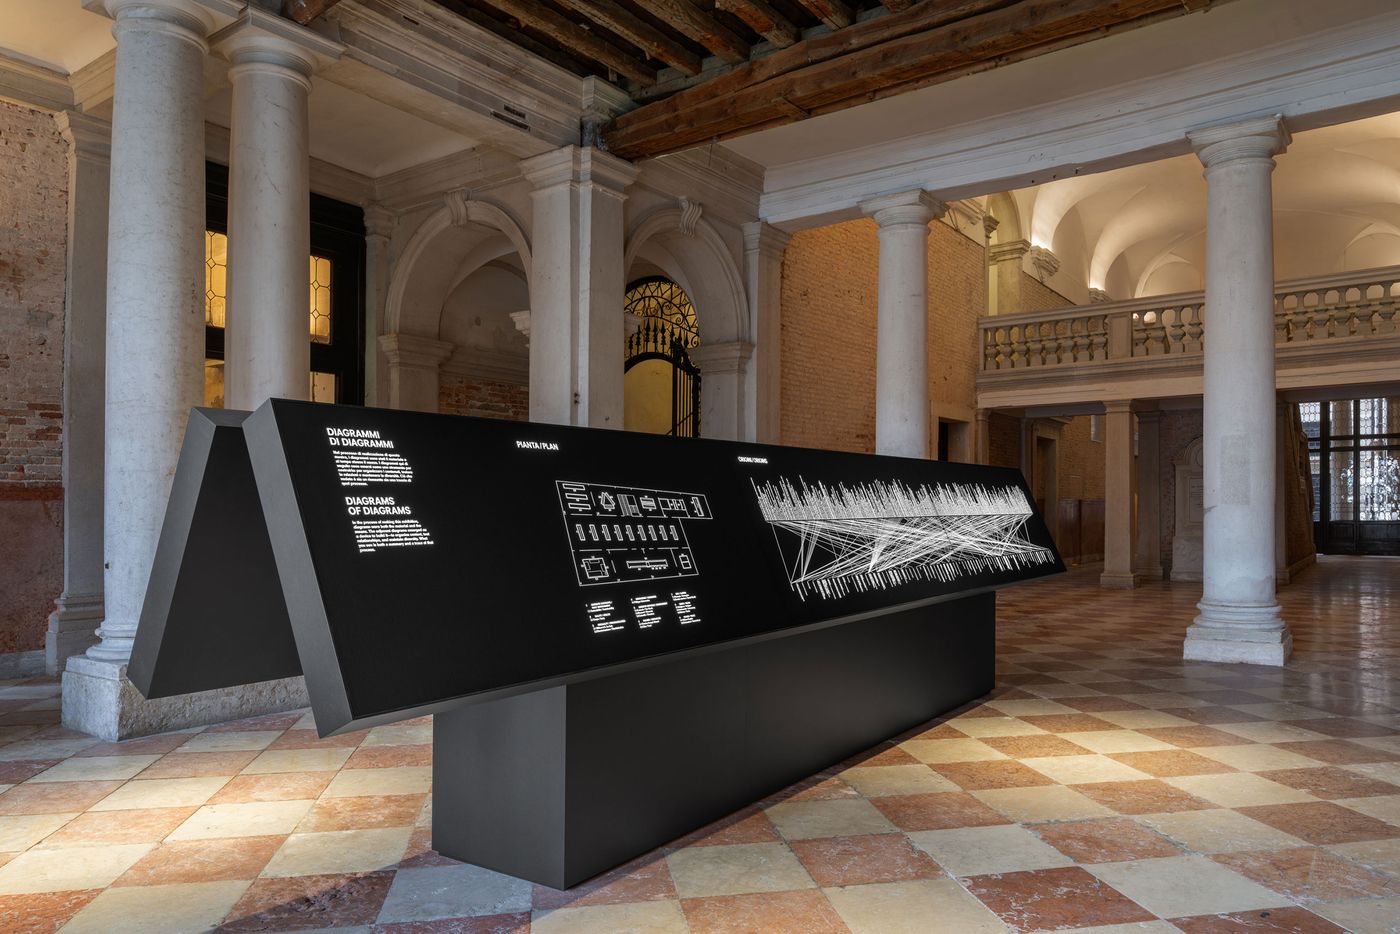
Exhibition view of “Diagrams: A Project by AMO/OMA”, Fondazione Prada, Venice. Photography by Marco Cappelletti. Courtesy: Fondazione Prada.
The exhibition unfolds across two floors, beginning with—what else?—a diagrammatic overview. Created by AMO/OMA, Diagrams of Diagrams on the palazzo’s ground floor is a series of meta-diagrams that chart everything from the exhibition’s layout to the origin, age, scale, and format of the exhibits themselves.
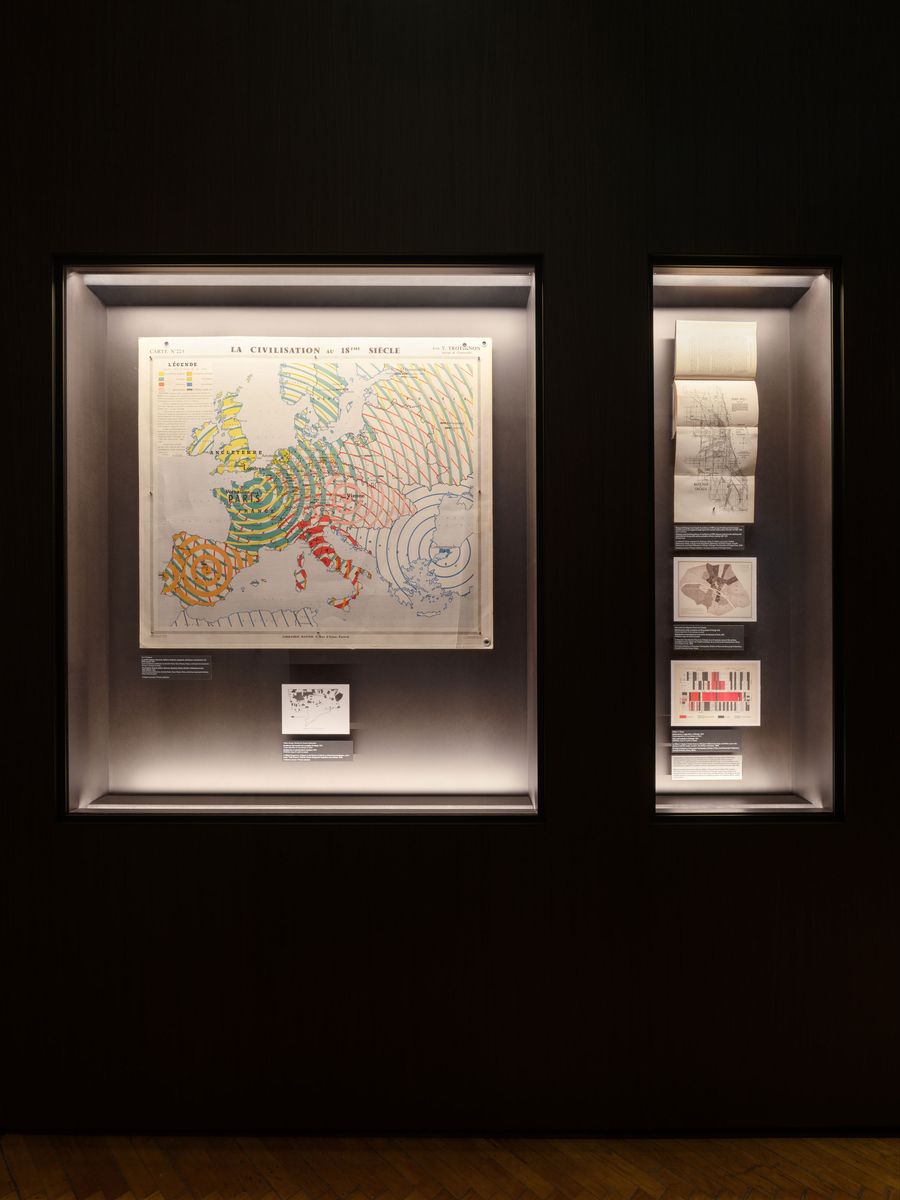
Upstairs, the first floor is arranged around a central hall containing nine large vitrines, each devoted to a different topic, what AMO/OMA call “now urgencies” based in the Built Environment, Health, Inequality, Migration, Environment, Resources, War, Truth, and Value. Around this space are smaller chambers where each topic is further examined through subthemes or the oeuvre of pivotal figures. It's as if the exhibition itself is behaving diagrammatically, toggling between macro and micro.
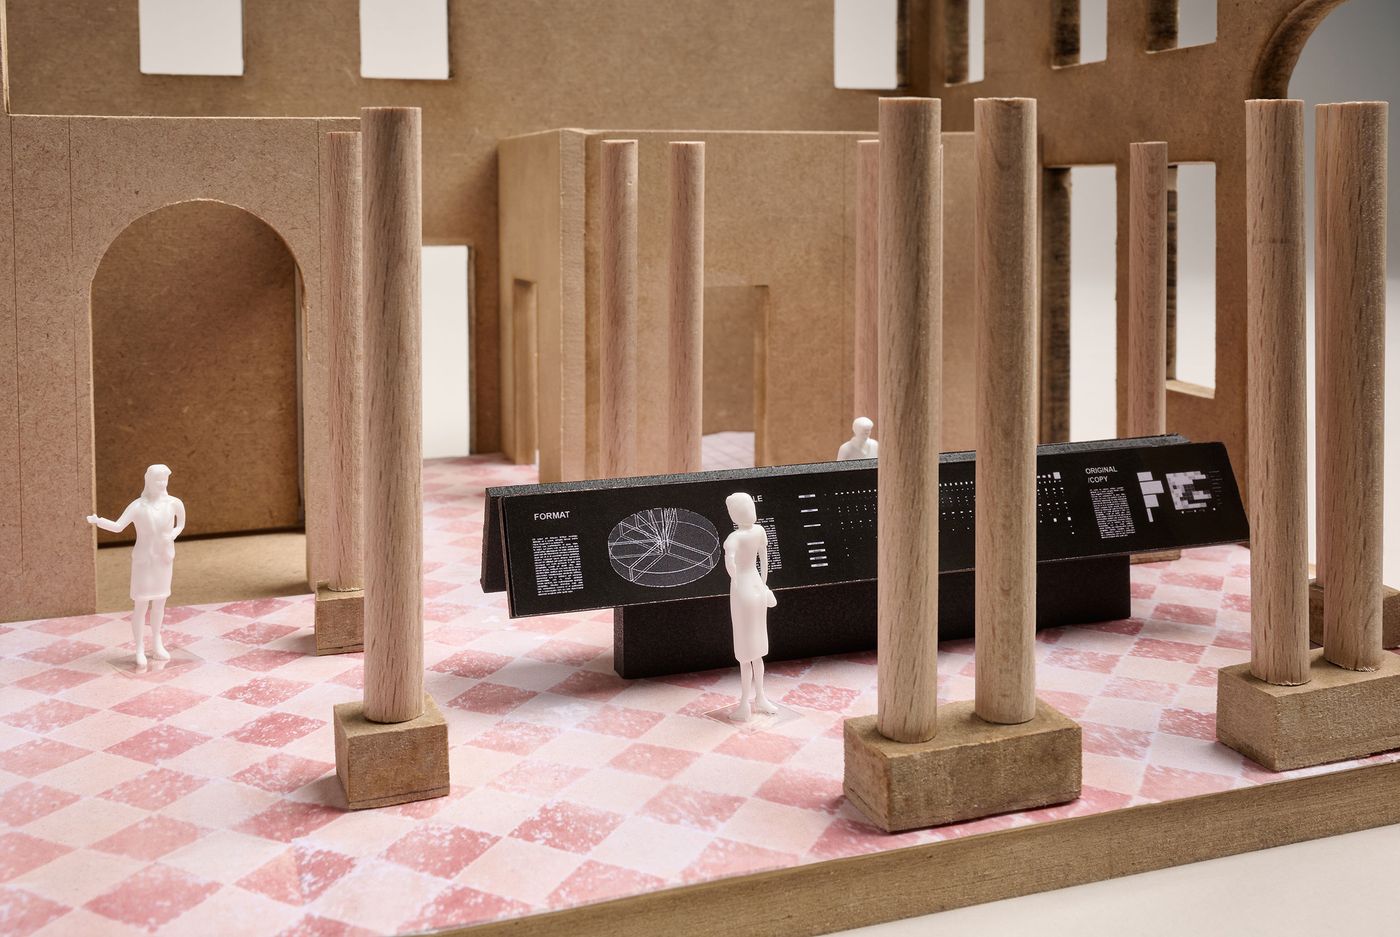
AMO/OMA. Model for the “Diagrams” exhibition, Ca’ Corner della Regina, Venice. Courtesy AMO/OMA. Photo by Frans Parthesius .
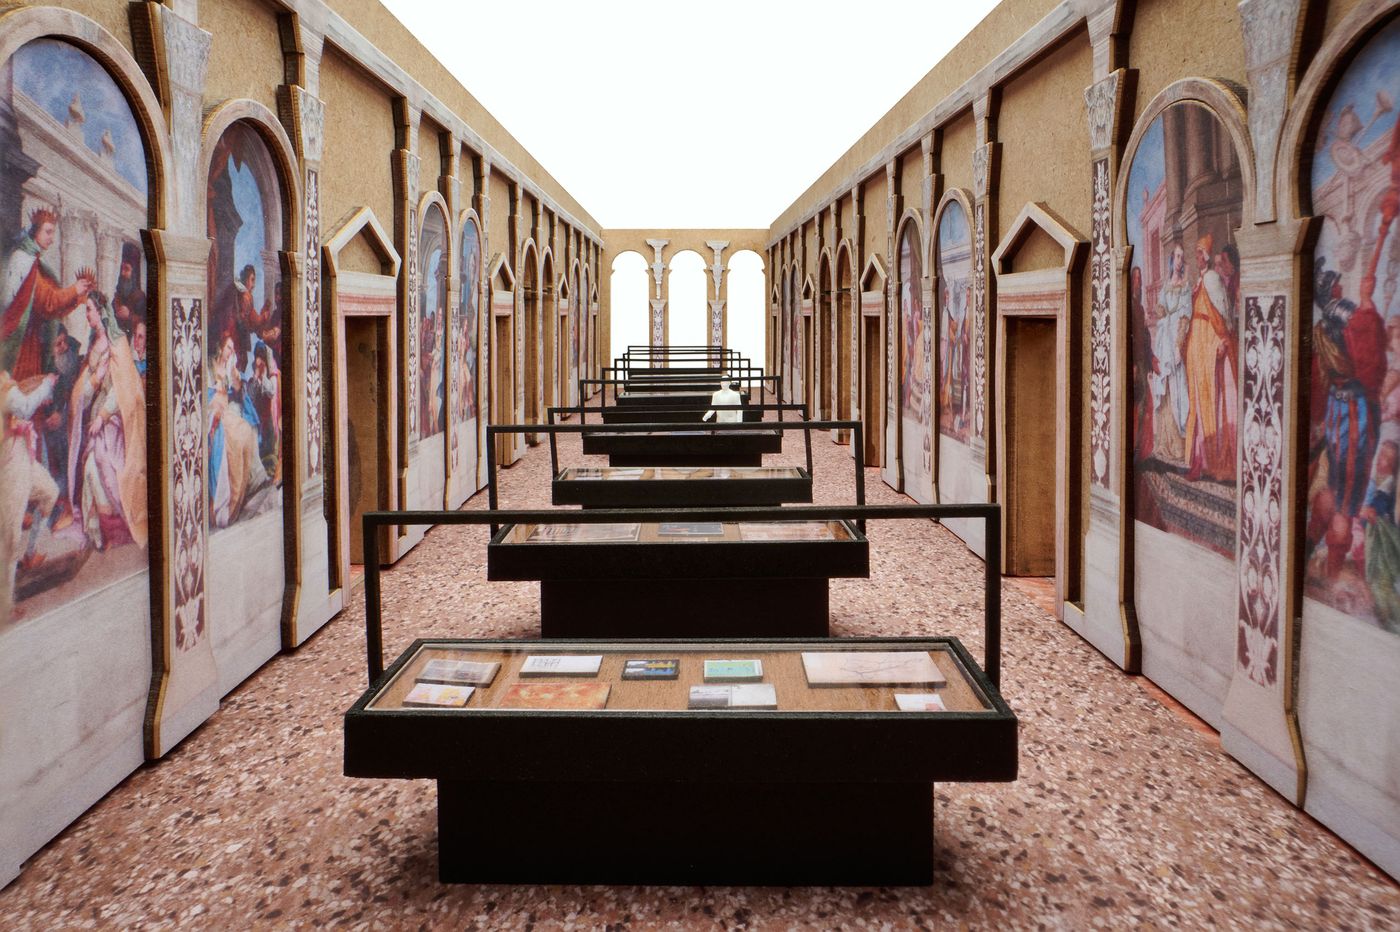
AMO/OMA. Model for the “Diagrams” exhibition, Ca’ Corner della Regina, Venice. Courtesy AMO/OMA. Photo by Frans Parthesius .
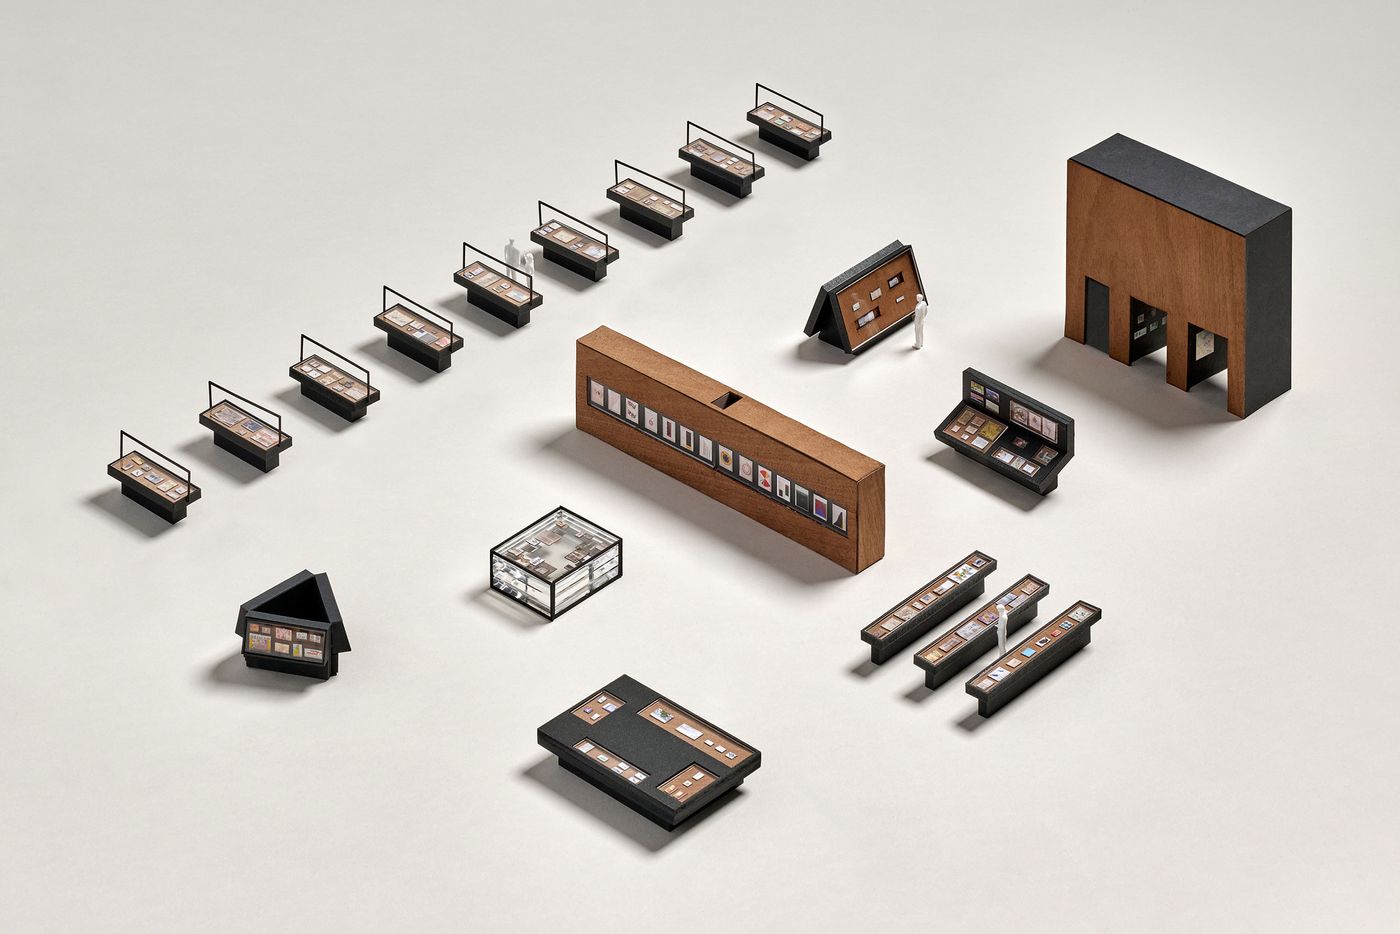
AMO/OMA. Model for the “Diagrams” exhibition, Ca’ Corner della Regina, Venice. Courtesy AMO/OMA. Photo by Frans Parthesius .
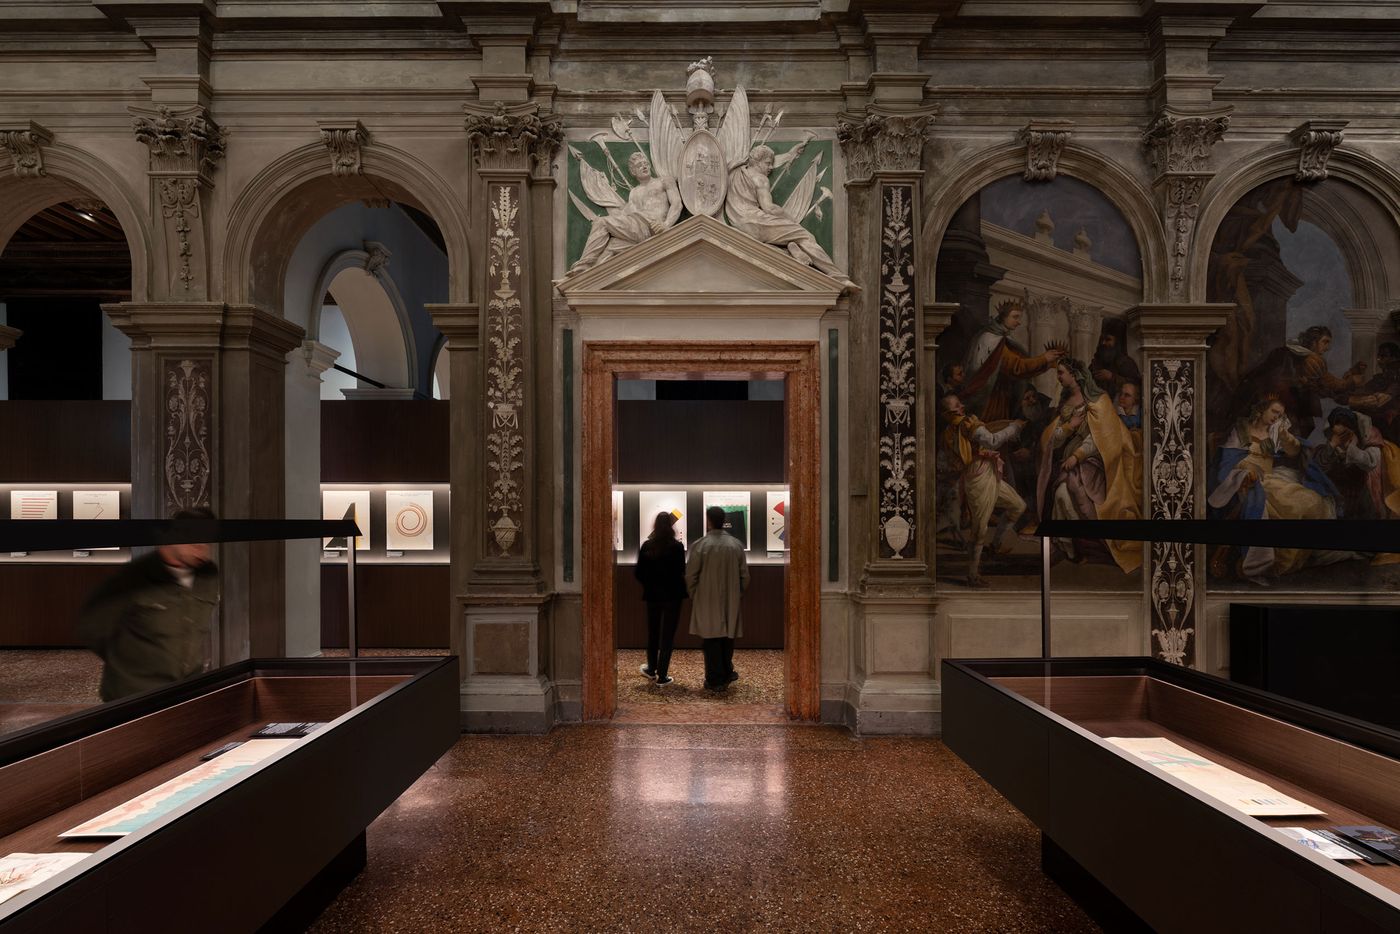
Exhibition view of “Diagrams: A Project by AMO/OMA”, Fondazione Prada, Venice. Photography by Marco Cappelletti. Courtesy: Fondazione Prada.
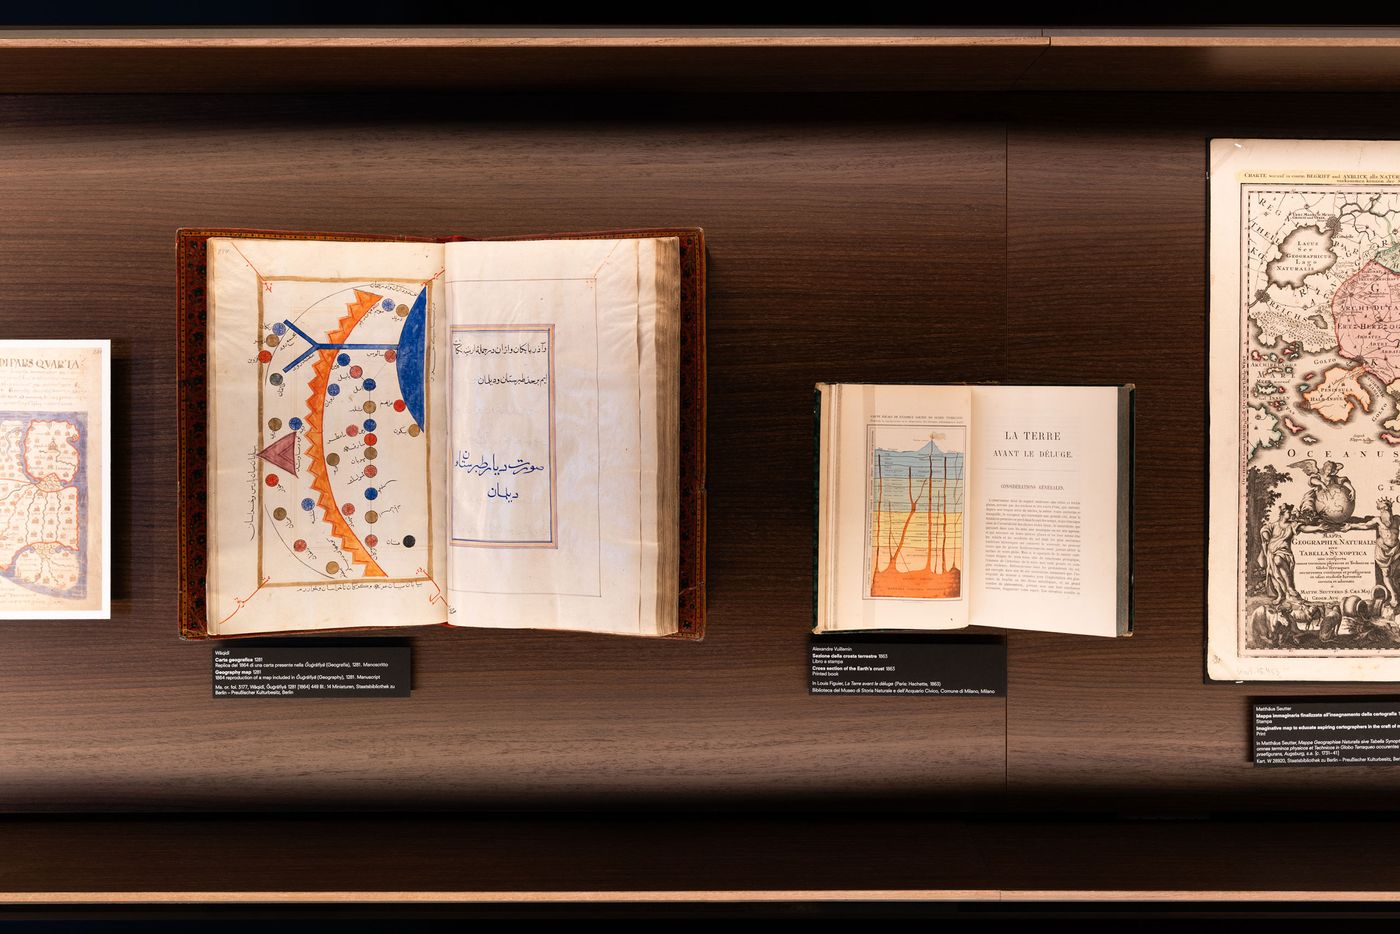
Exhibition view of “Diagrams: A Project by AMO/OMA”, Fondazione Prada, Venice. Photography by Marco Cappelletti. Courtesy: Fondazione Prada.
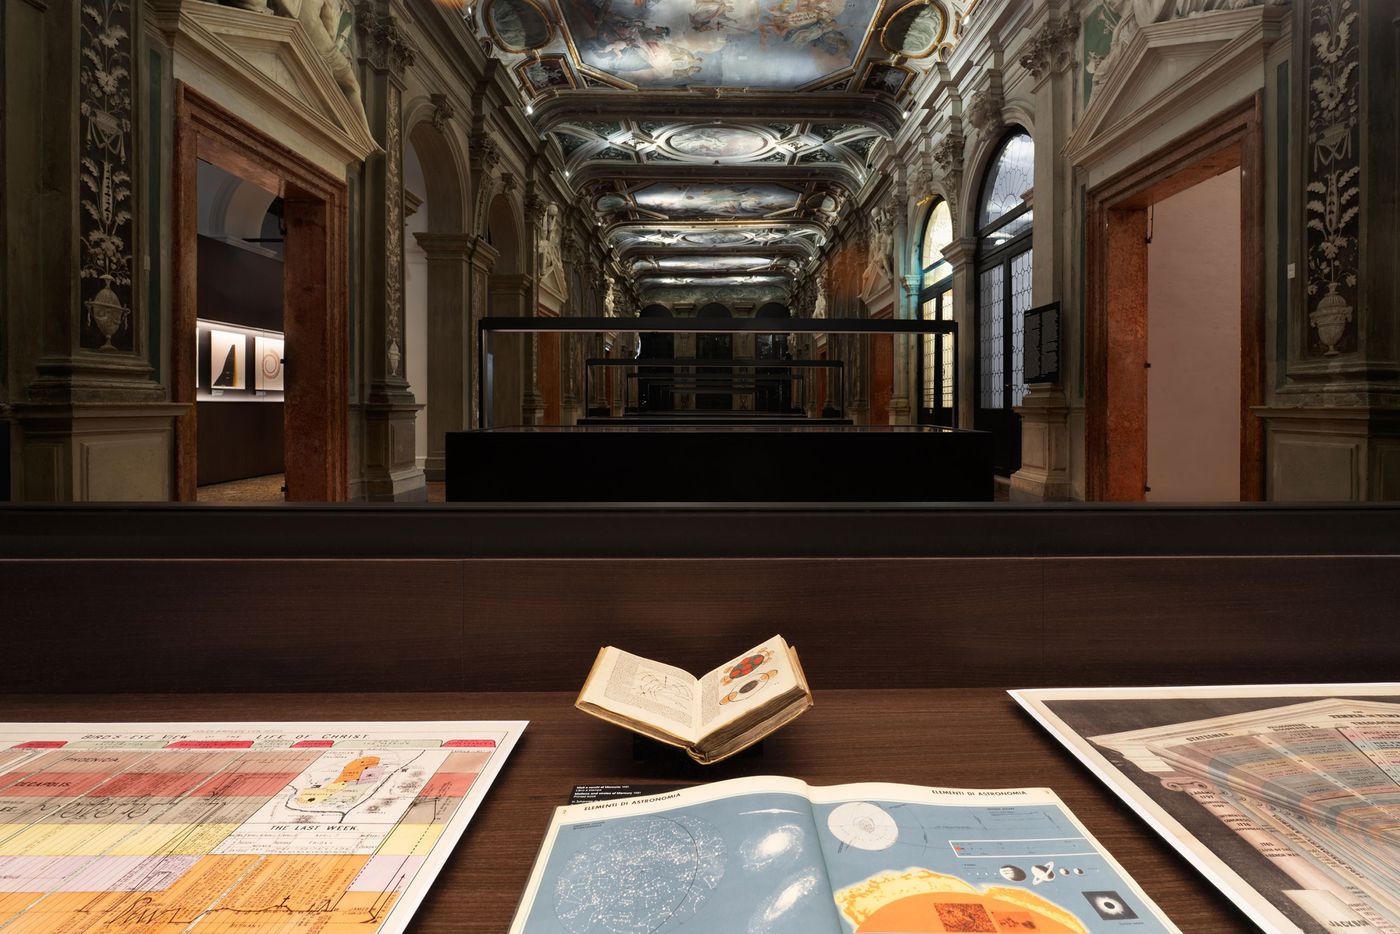
Exhibition view of “Diagrams: A Project by AMO/OMA”, Fondazione Prada, Venice. Photography by Marco Cappelletti. Courtesy: Fondazione Prada.
American sociologist, historian, author and activist W.E.B. Du Bois, one of the premier Black scholars of his time, provides the exhibition’s powerful starting point. His 1900 infographics for “The Exhibit of American Negroes” at the Exposition Universelle in Paris—dazzling for both their formal clarity and their radical content—asserted a data-driven case for African-American agency and dignity at a time when neither was a given. These diagrams weren’t just illustrations; they were acts of resistance.
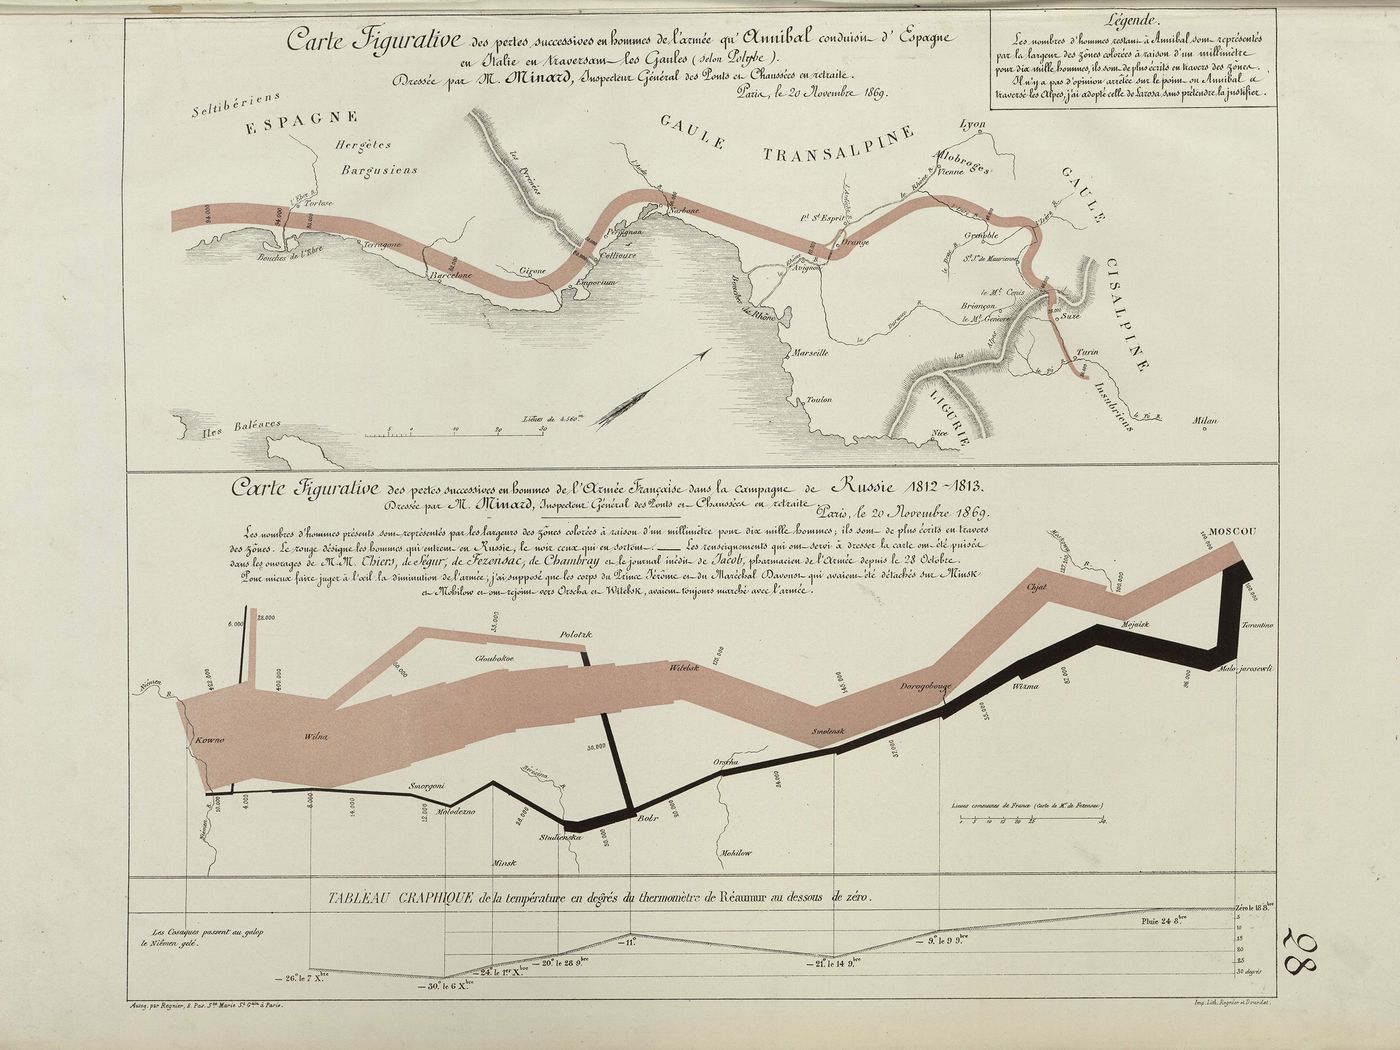
From here, “Diagrams” sweeps across centuries and continents. Florence Nightingale’s rose charts on Crimean War mortality make an appearance, showcasing how clarity can affect policy. Charles Joseph Minard’s famed graphic of Napoleon’s Russian campaign—long admired by data nerds and designers alike—invites us to reconsider how the visual compression of horror becomes a modern form of storytelling.
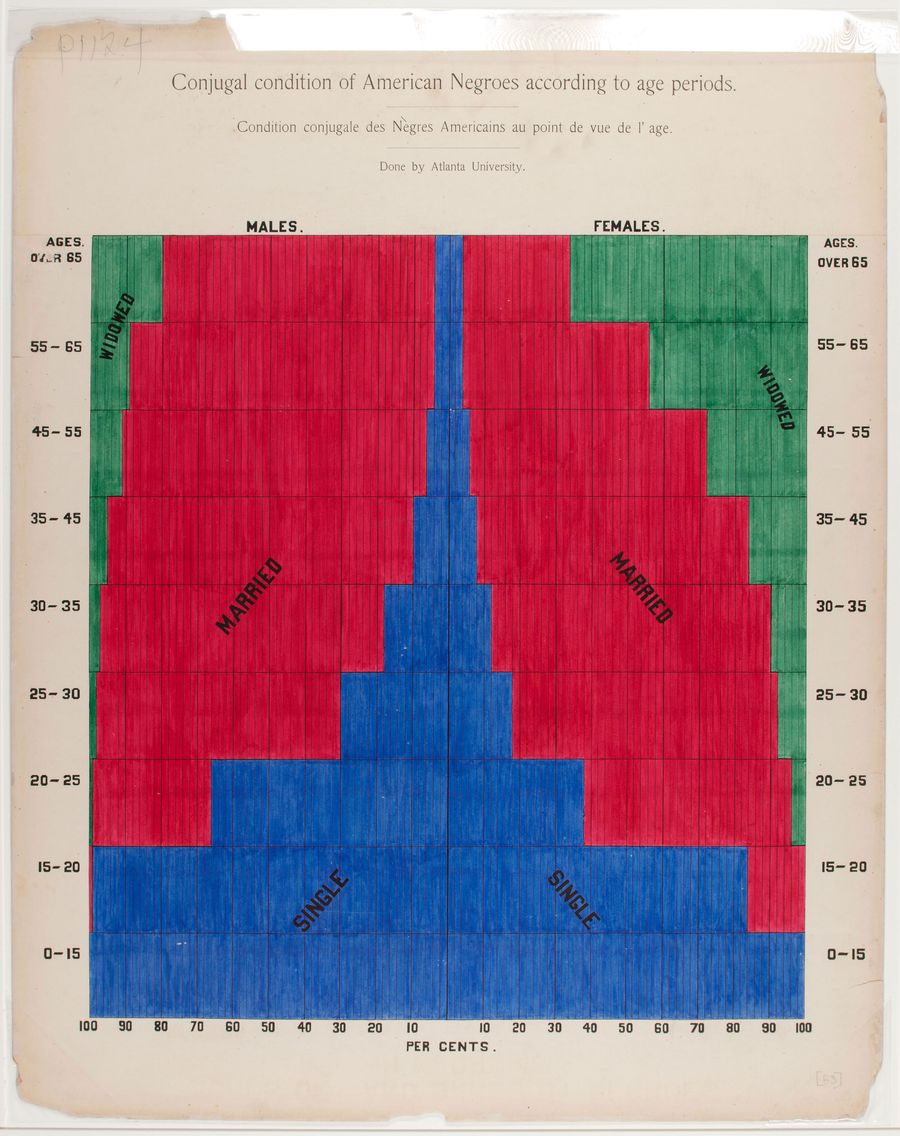
W.E.B. Du Bois. Conjugal condition of American Negroes according to age periods, c. 1900. Exhibition copy of a statistical chart illustrating the condition of the descendants of former African slaves now in residence in the United States of America, Atlanta University. Ink and watercolor on paper. Daniel Murray Collection, Prints and Photographs Division, Library of Congress, Washington, D.C. Courtesy Library of Congress, Prints and Photographs Division Washington, D.C., Daniel Murray Collection.
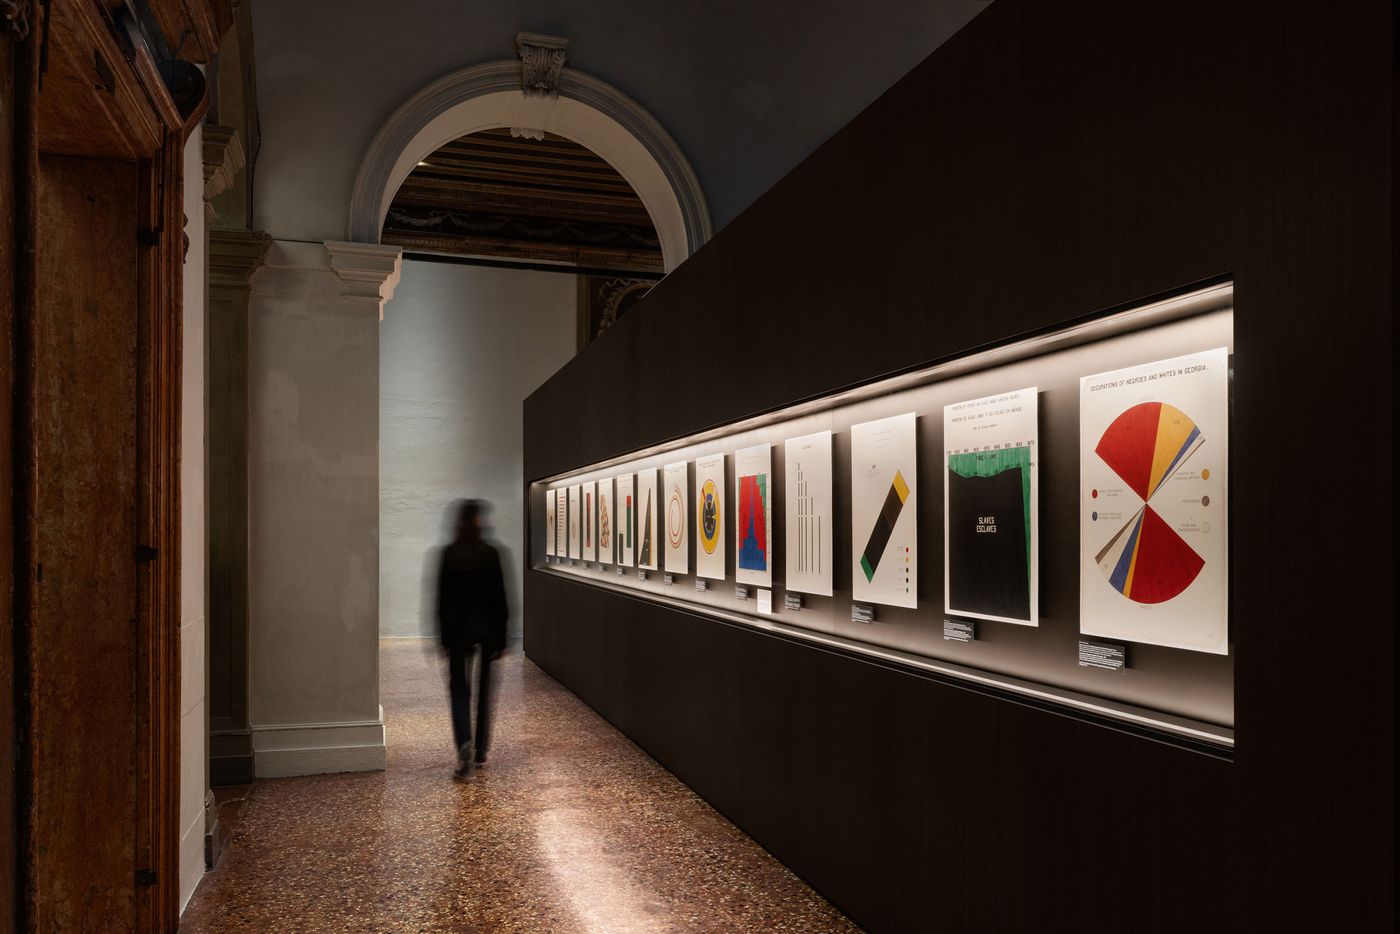
Exhibition view of “Diagrams: A Project by AMO/OMA”, Fondazione Prada, Venice. Photography by Marco Cappelletti. Courtesy: Fondazione Prada.
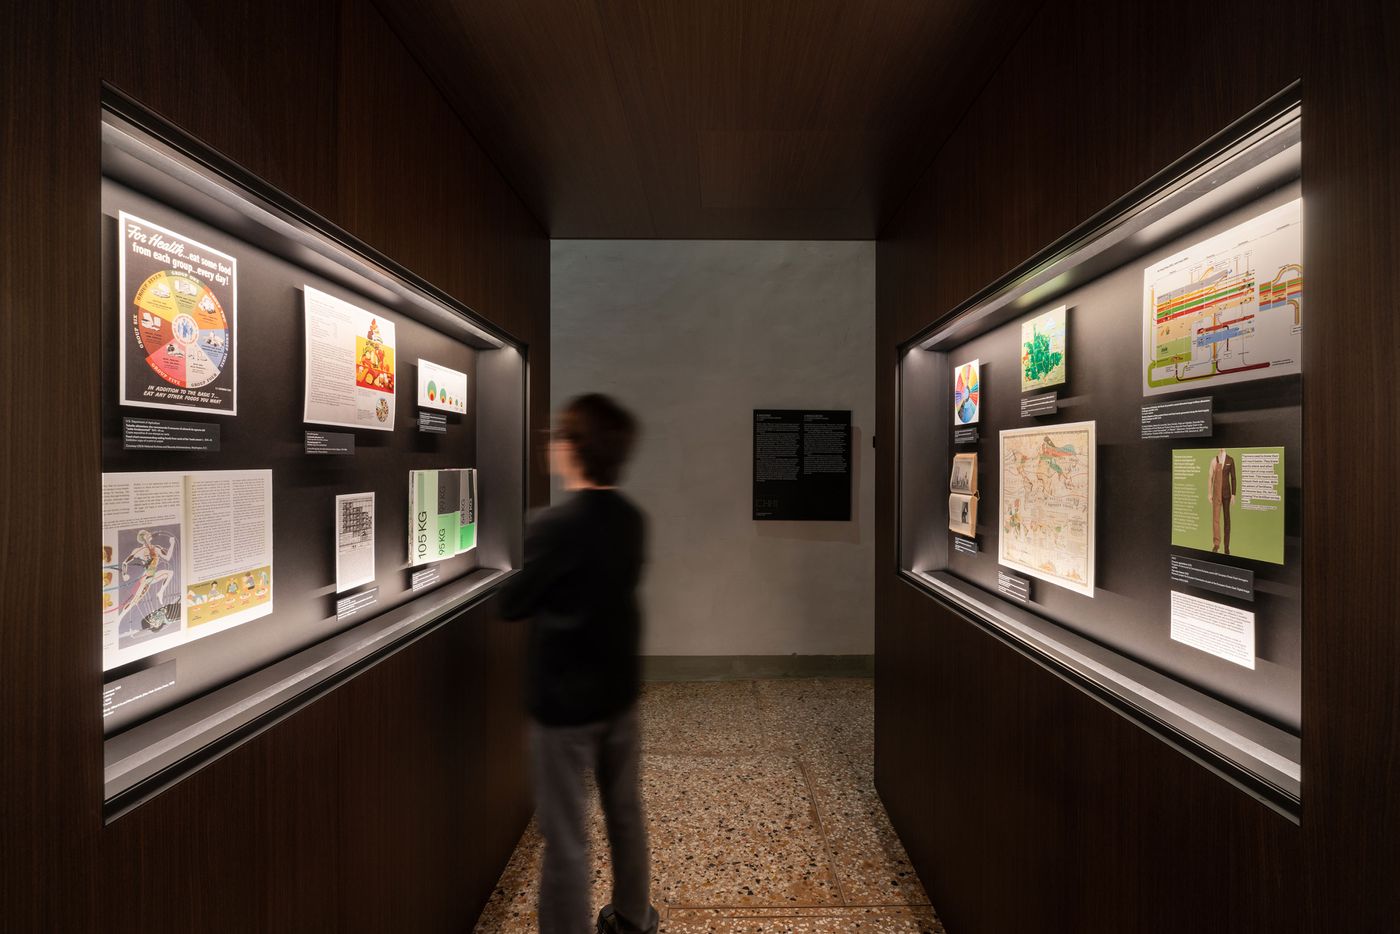
Exhibition view of “Diagrams: A Project by AMO/OMA”, Fondazione Prada, Venice. Photography by Marco Cappelletti. Courtesy: Fondazione Prada.

Exhibition view of “Diagrams: A Project by AMO/OMA”, Fondazione Prada, Venice. Photography by Marco Cappelletti. Courtesy: Fondazione Prada.
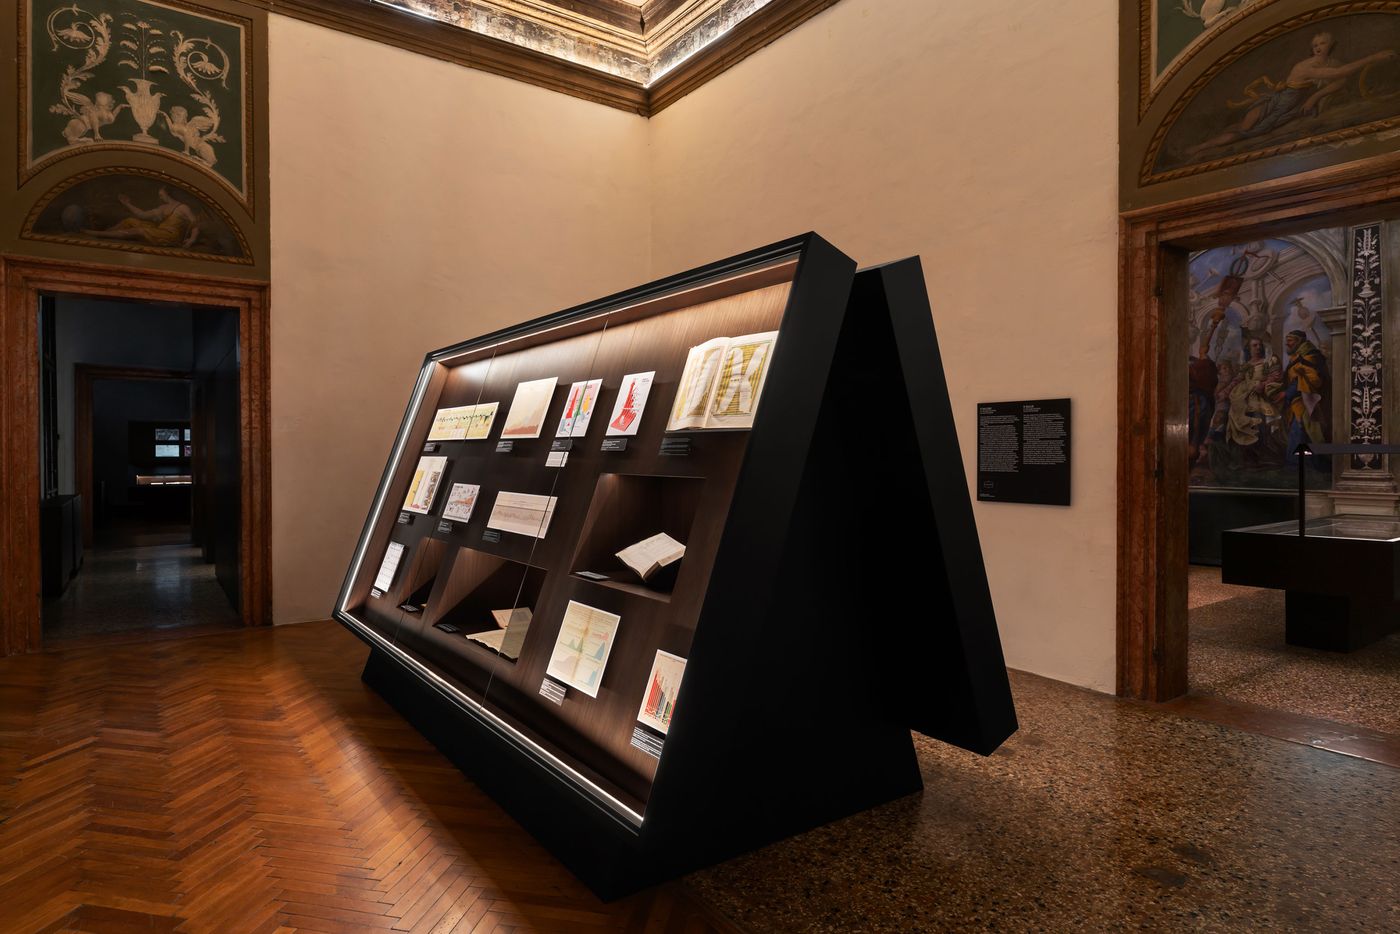
Exhibition view of “Diagrams: A Project by AMO/OMA”, Fondazione Prada, Venice. Photography by Marco Cappelletti. Courtesy: Fondazione Prada.
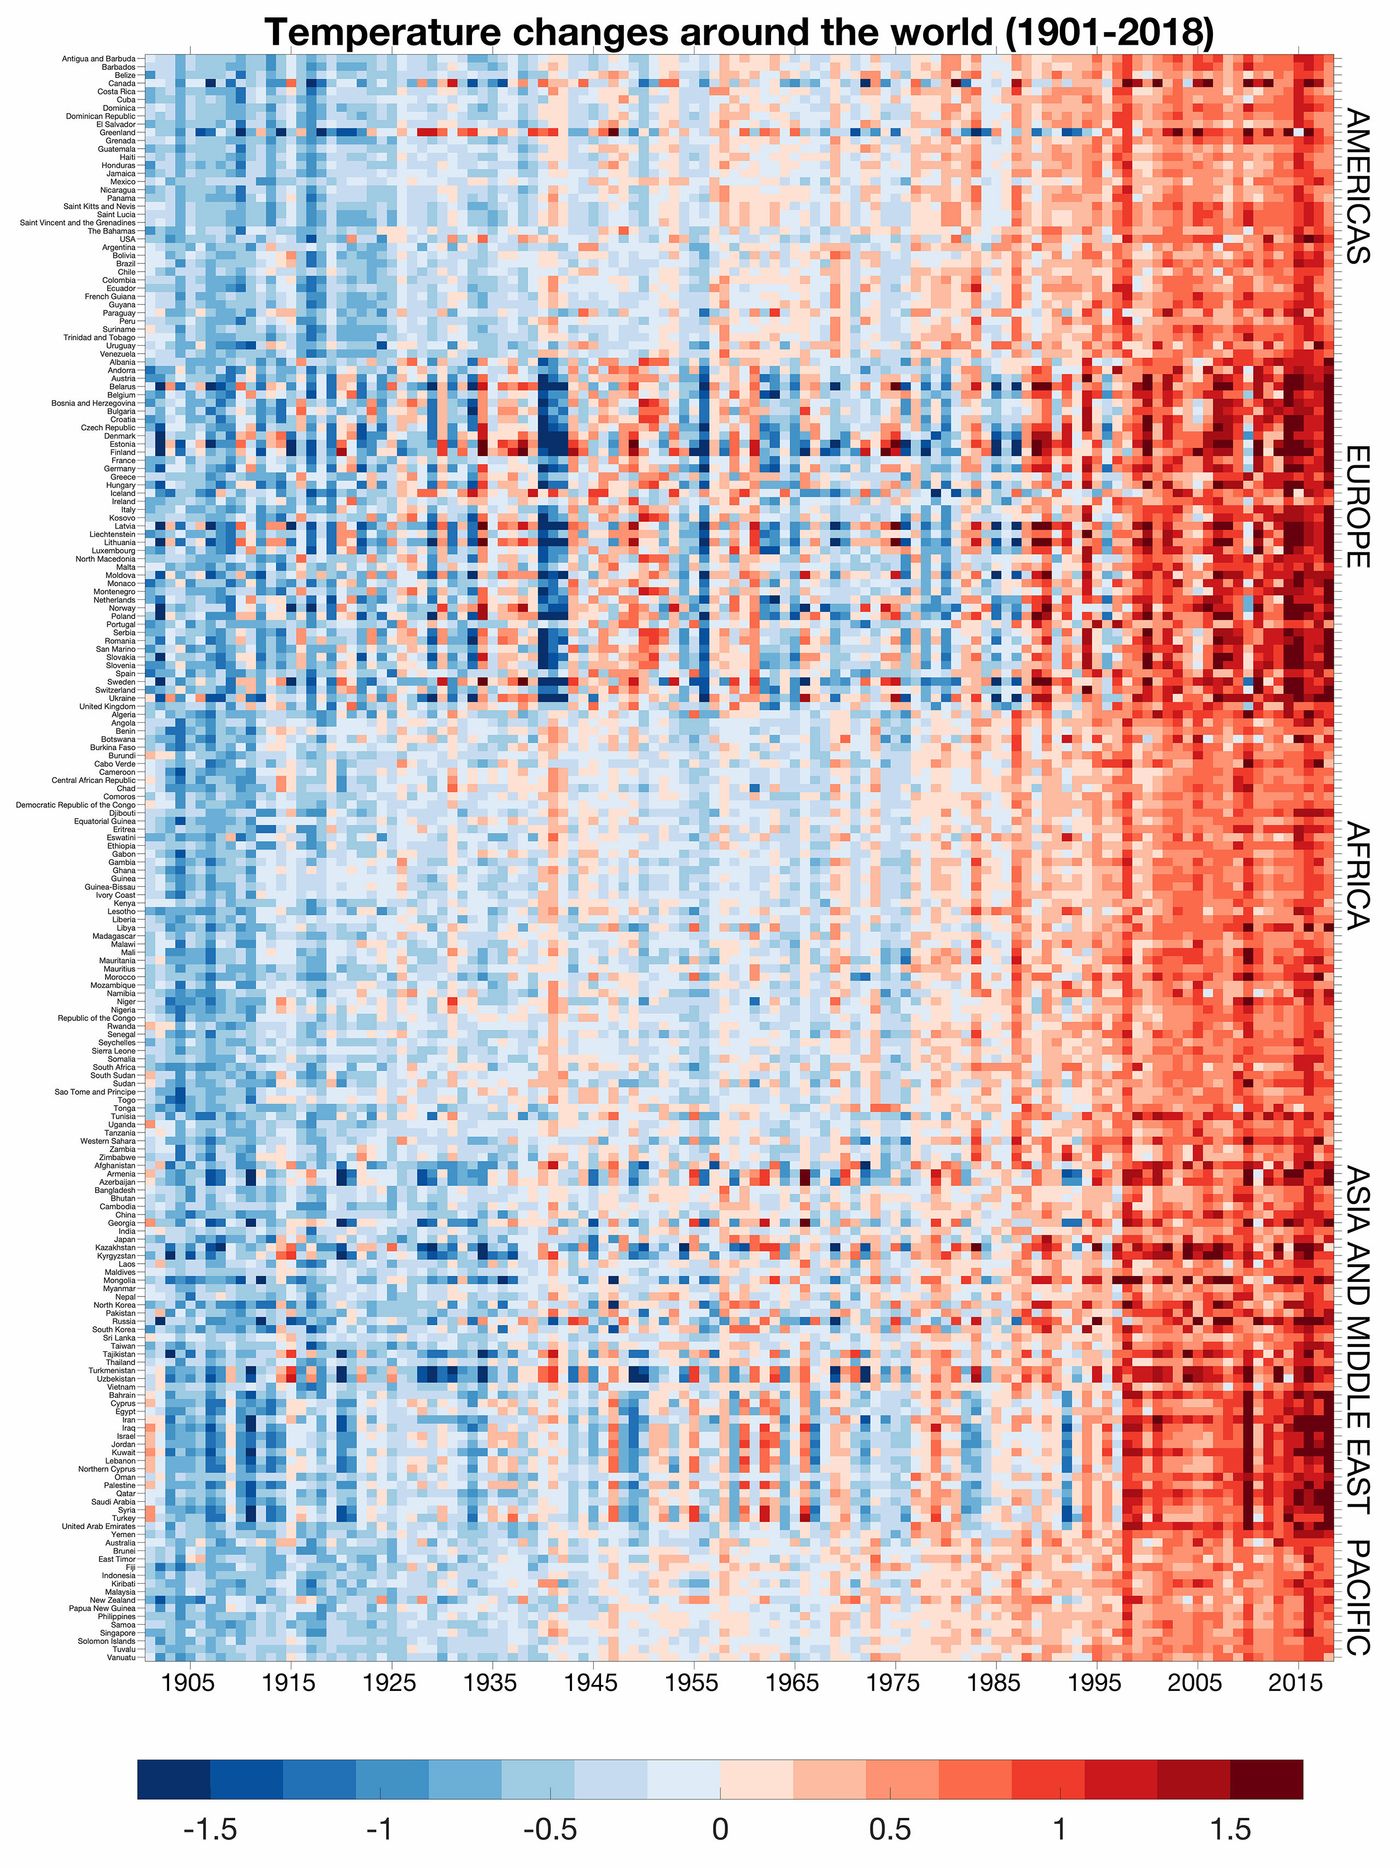
Yet the exhibition is far from nostalgic. Contemporary works, such as climatologist Ed Hawkins’ hauntingly simple "Climate Stripes" graphic—a sequence of colour-coded bars that transforms decades of temperature data into an arresting visual index of climate crisis—demonstrate how diagrams can still cut through noise with visceral clarity. In a nearby room, two diagrams created by AMO map the migration patterns of students from China, Europe, and the United States, revealing global education as a complex, asymmetrical flow of aspiration and opportunity. More than merely visualizing data, these diagrams confront us with the state of our world, swapping tidy conclusions for urgent questions.
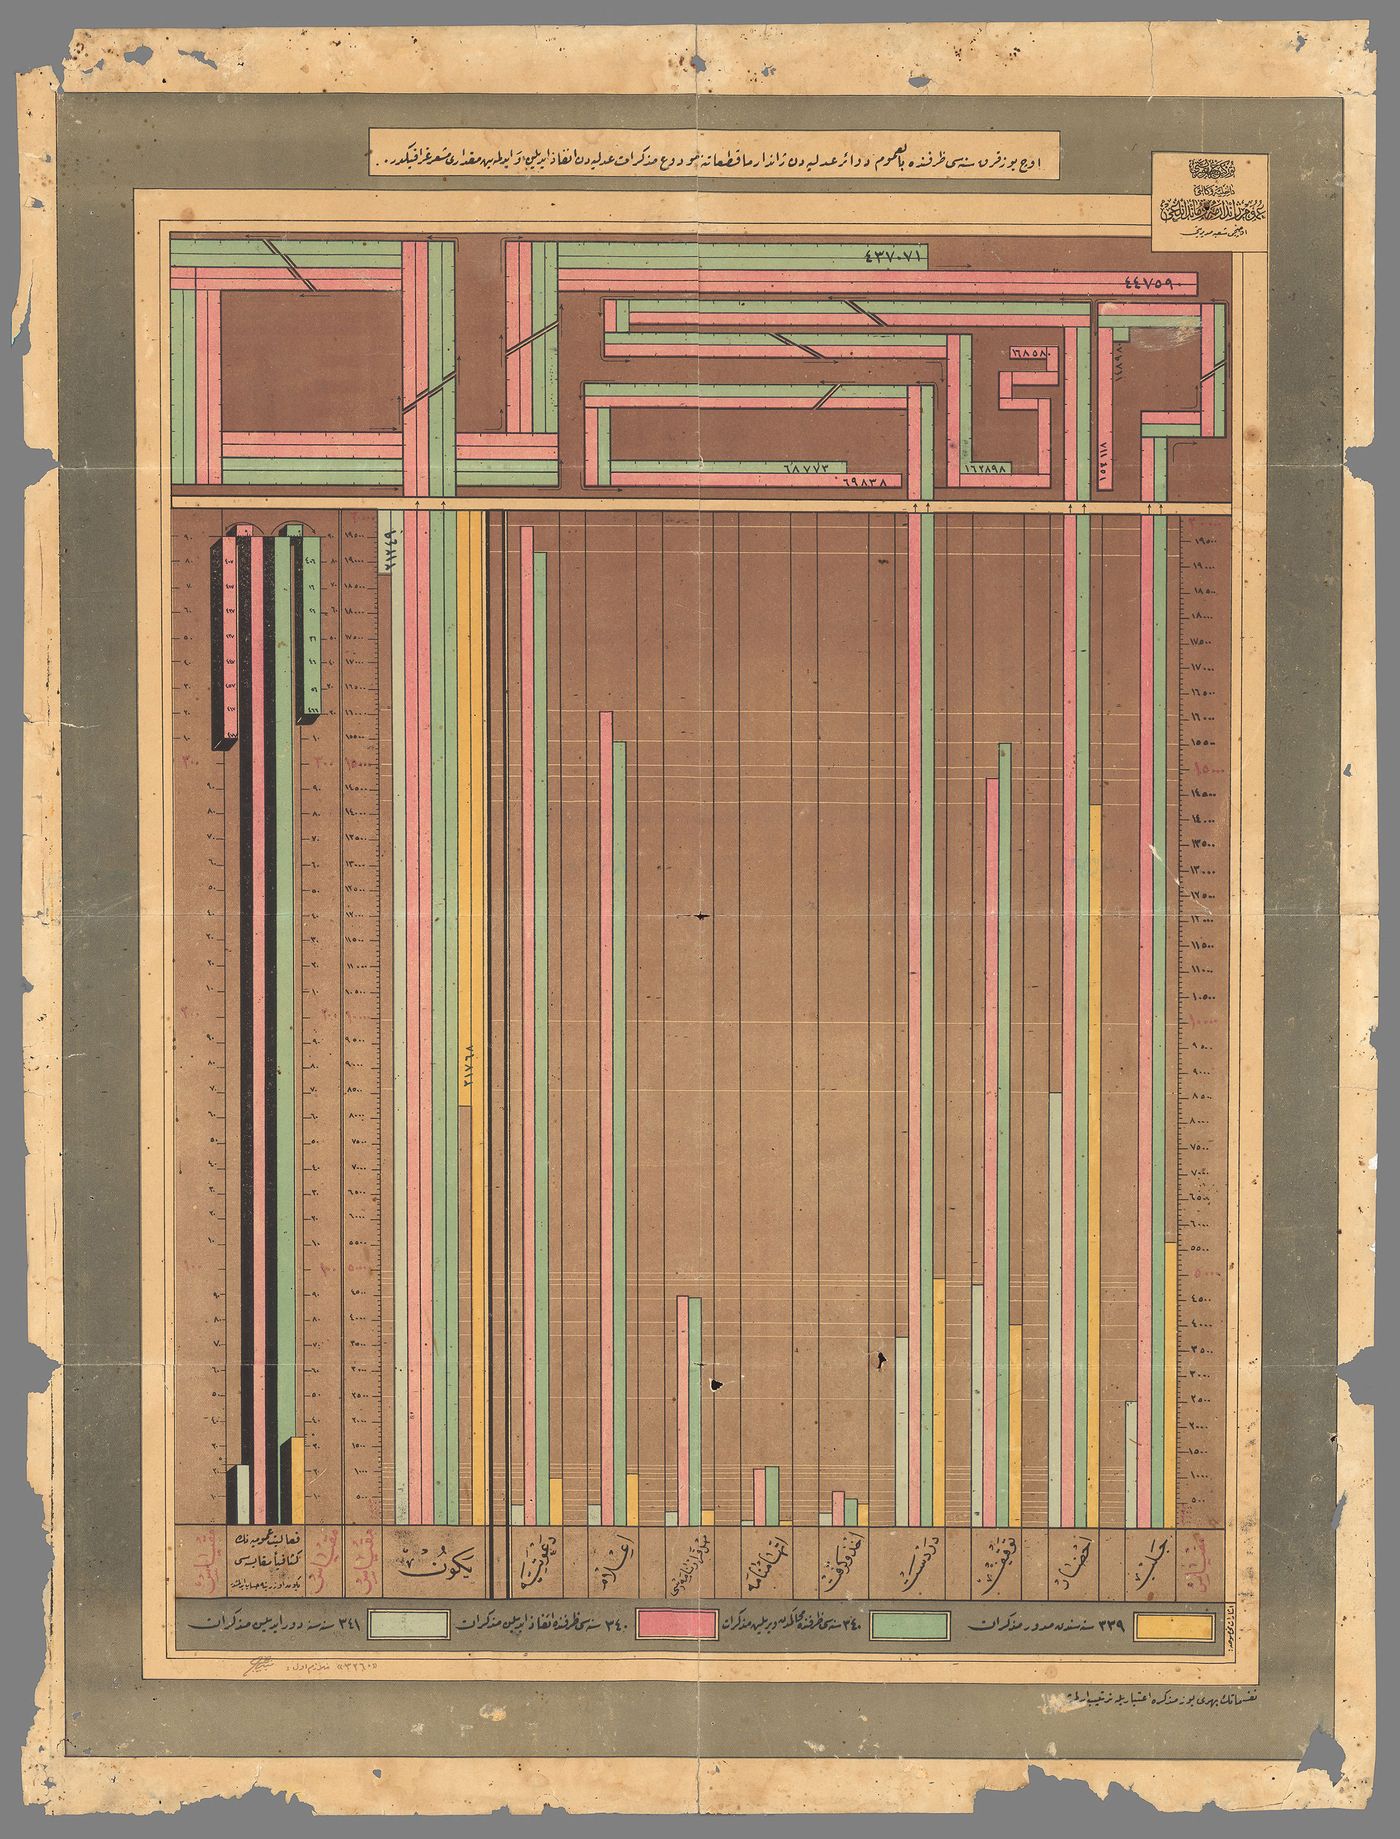
Not all diagrams aim to elucidate or educate though; many are purposefully created to obfuscate—particularly in our algorithmically accelerated world. One gallery quietly suggests how the diagram, weaponized by propaganda or distorted through scale, can become a tool of epistemic violence.
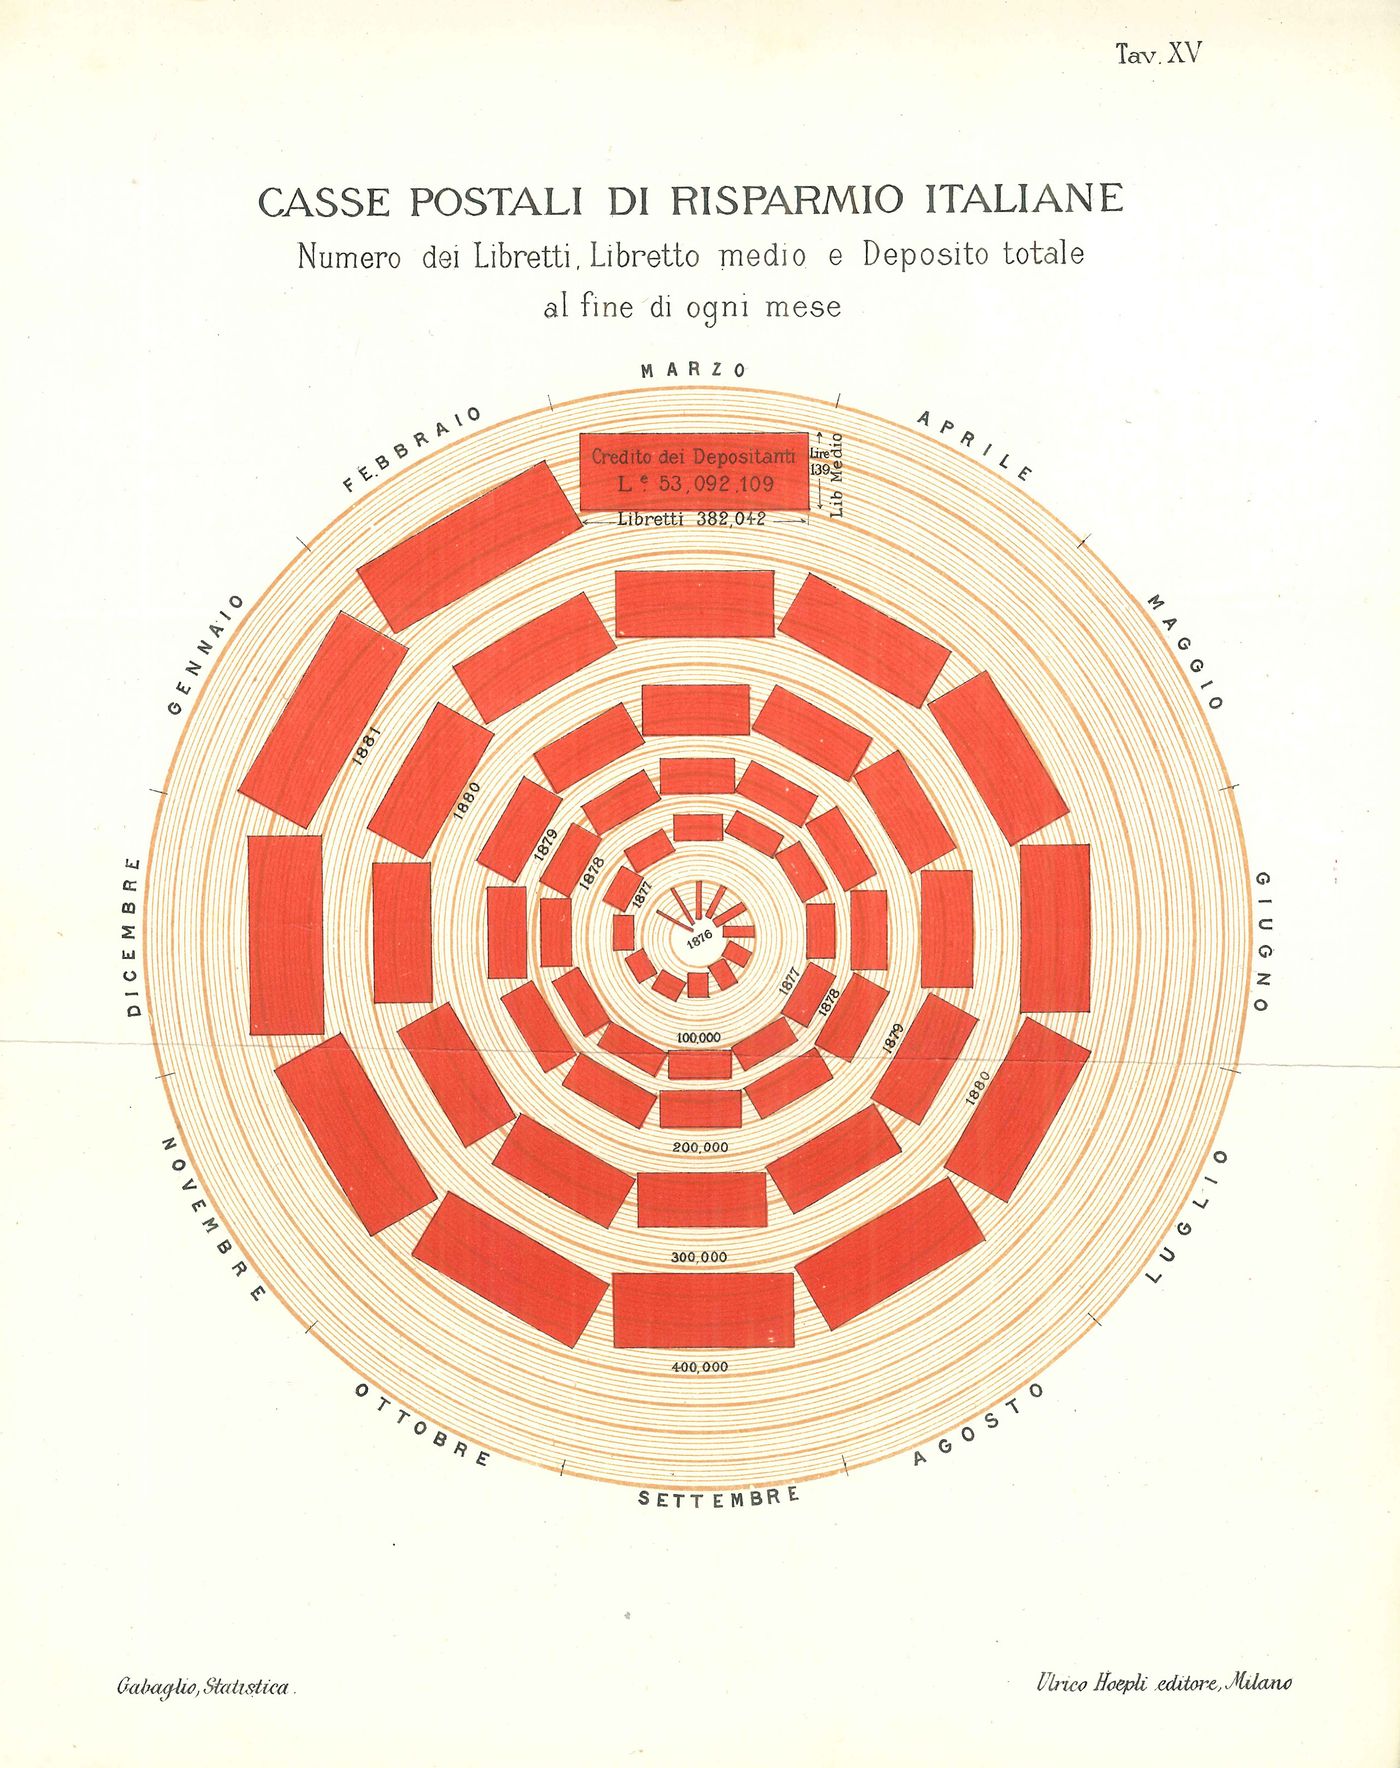
Italian postal savings banks. Number of passbooks. Average passbook and total deposit at the end of each month from 1876 to 1880, 1888. Printed book. In Antonio Gabaglio, Teoria generale di statistica (Milano: Ulrico Hoepli, 1888). Fondazione Giangiacomo Feltrinelli, Milano. Courtesy Fondazione Giangiacomo Feltrinelli, Milan.
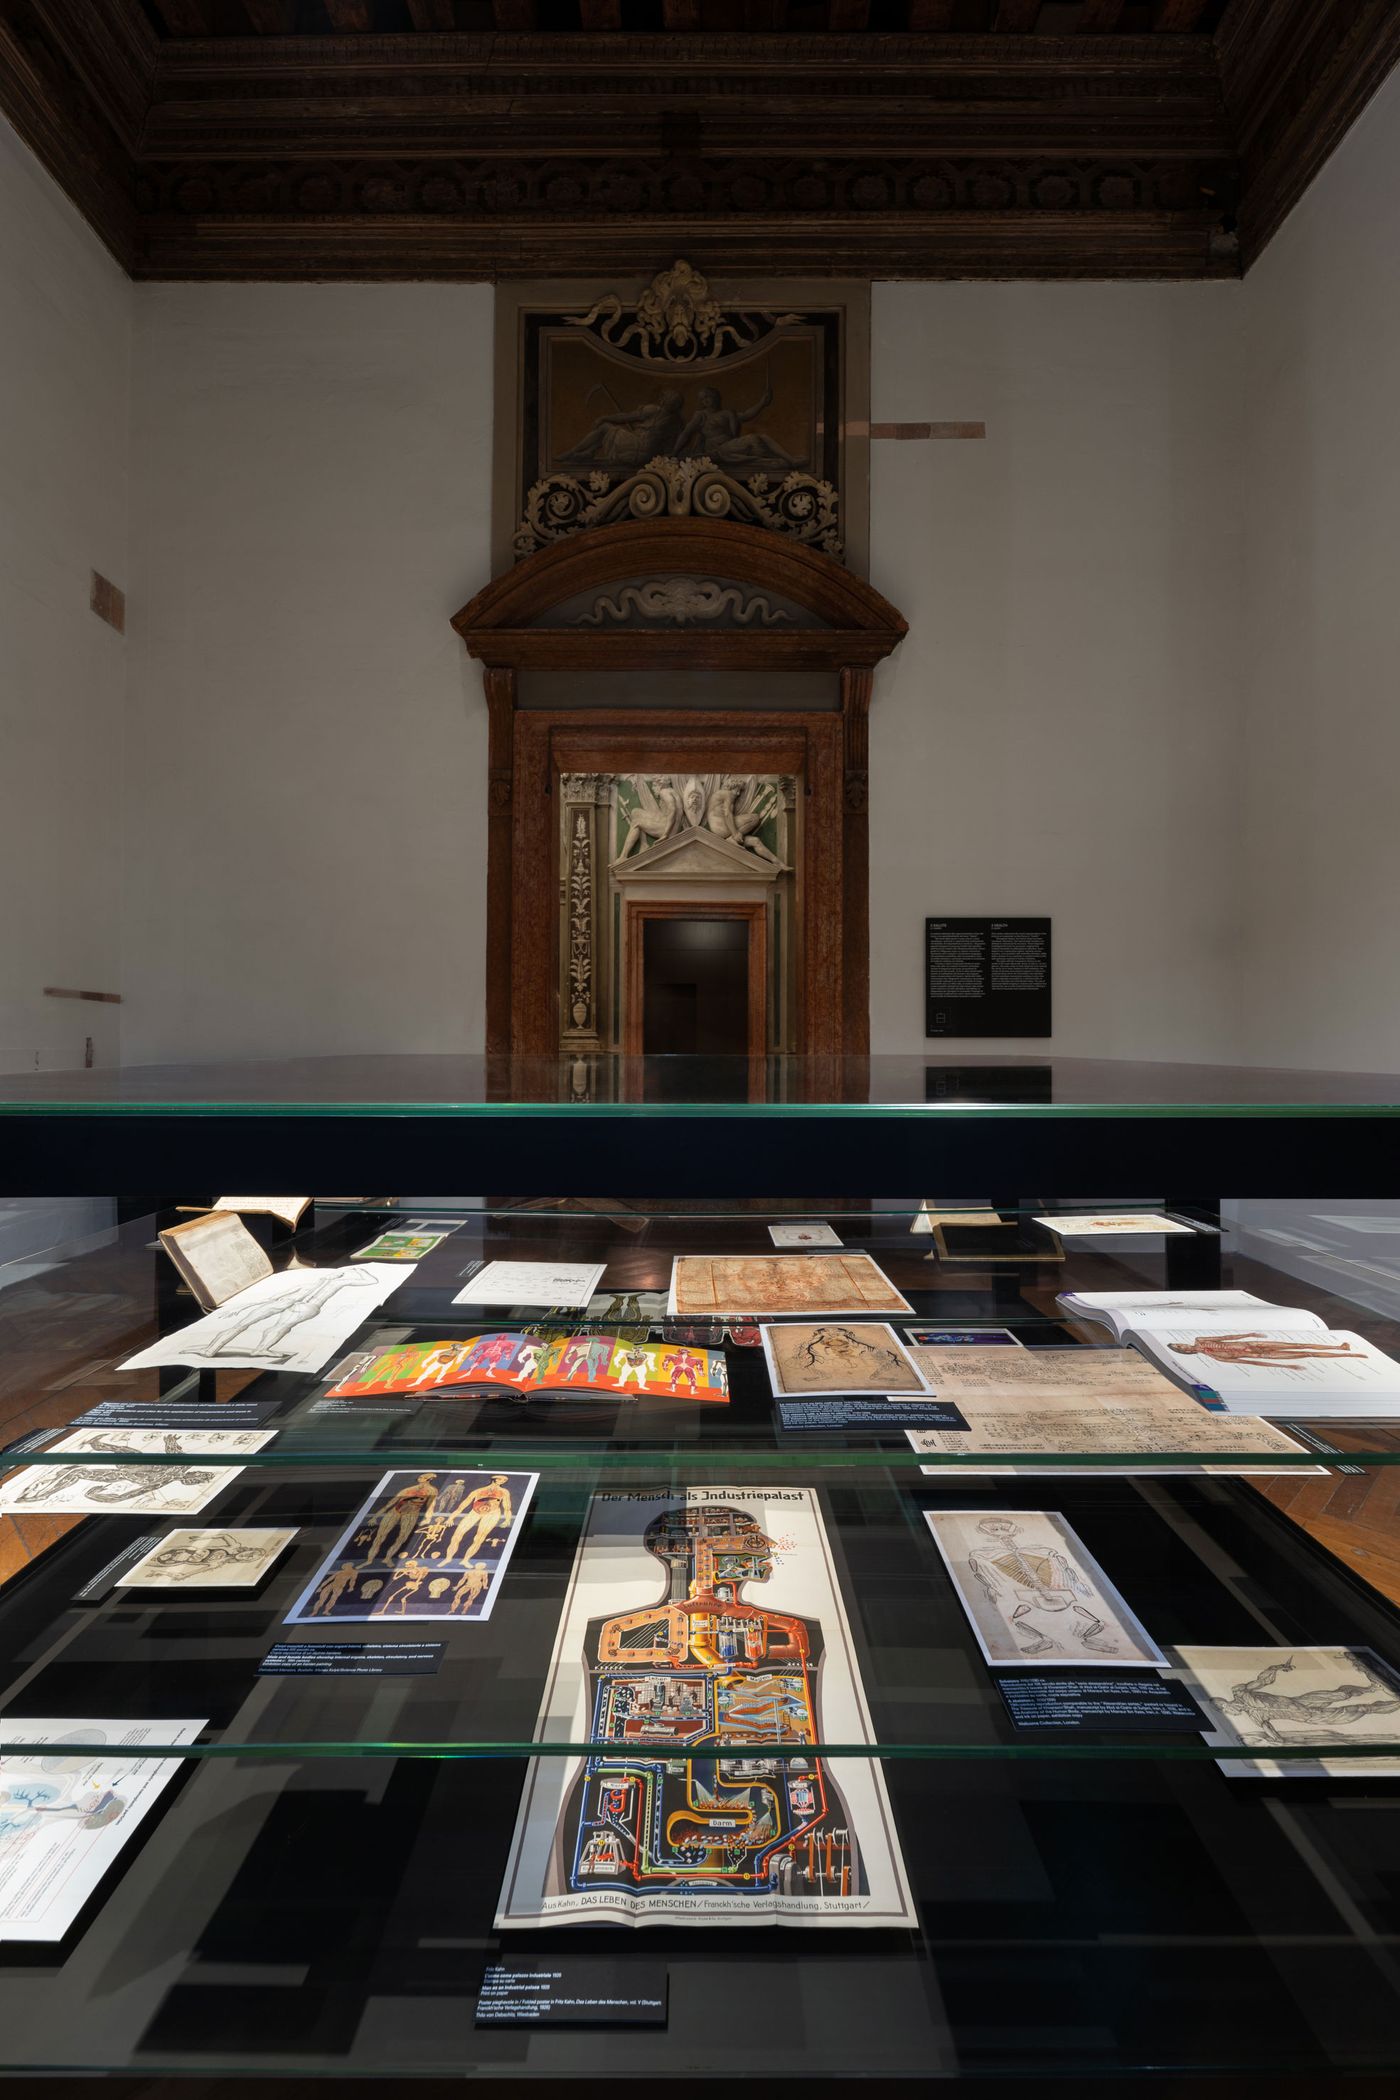
Exhibition view of “Diagrams: A Project by AMO/OMA”, Fondazione Prada, Venice. Photography by Marco Cappelletti. Courtesy: Fondazione Prada.
Diagrams have long been an integral part of AMO/OMA’s research-driven design practice—Koolhaas and his team have been using them to illustrate the feasibility of complex ideas since the 1970s, transforming abstract concepts into tangible, persuasive forms. It’s no surprise, then, that despite the sheer abundance of infographics on display, the exhibition never overwhelms or numbs. Instead, it offers a counterpoint to the rapid, often superficial visual culture of our time. At a time when visual communication often races past us—too swift to register, too polished to provoke—“Diagrams” encourages us to pause, reflect, and perhaps re-draw our assumptions about the world around us.
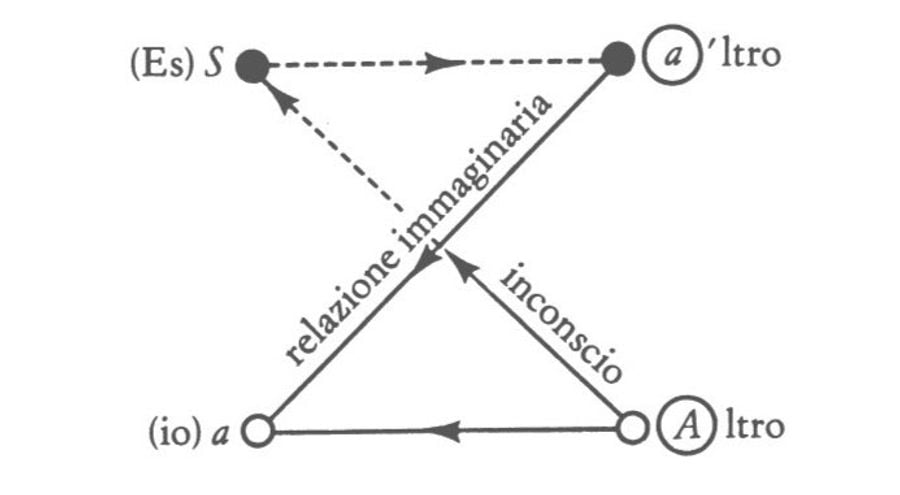
The imaginary function of the ego and the discourse of the unconscious, 1954–55. Printed book. In Jaques Lacan, Il seminario. Libro II. L’io nella teoria di Freud e nella tecnica della psicoanalisi (Turin: Einaudi, 2006 [1954–55]). Private collection. Courtesy Giulio Einaudi Editore, Turin.
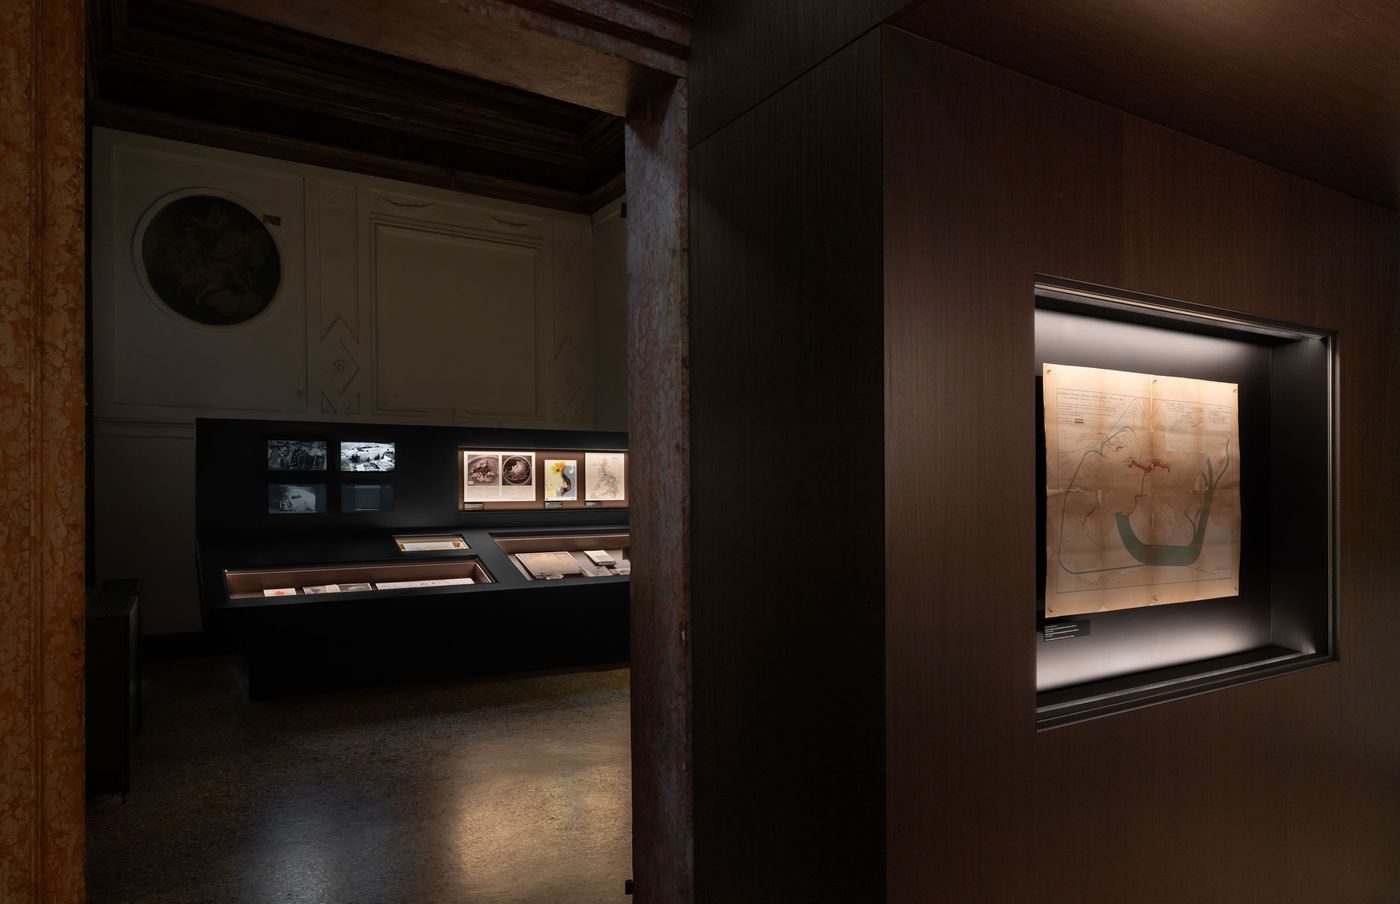
Exhibition view of “Diagrams: A Project by AMO/OMA”, Fondazione Prada, Venice. Photography by Marco Cappelletti. Courtesy: Fondazione Prada.
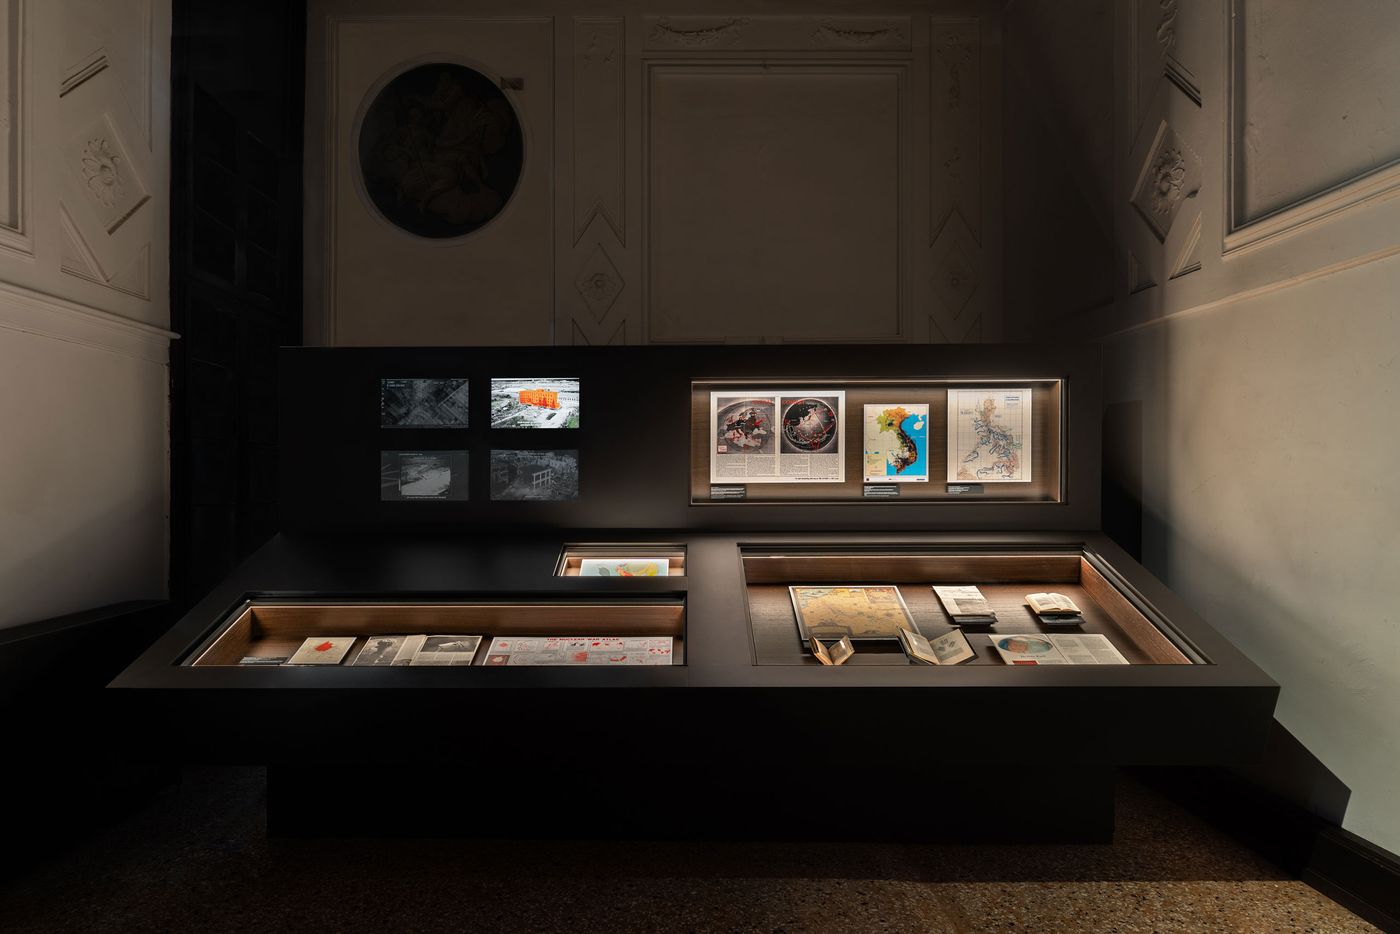
Exhibition view of “Diagrams: A Project by AMO/OMA”, Fondazione Prada, Venice. Photography by Marco Cappelletti. Courtesy: Fondazione Prada.
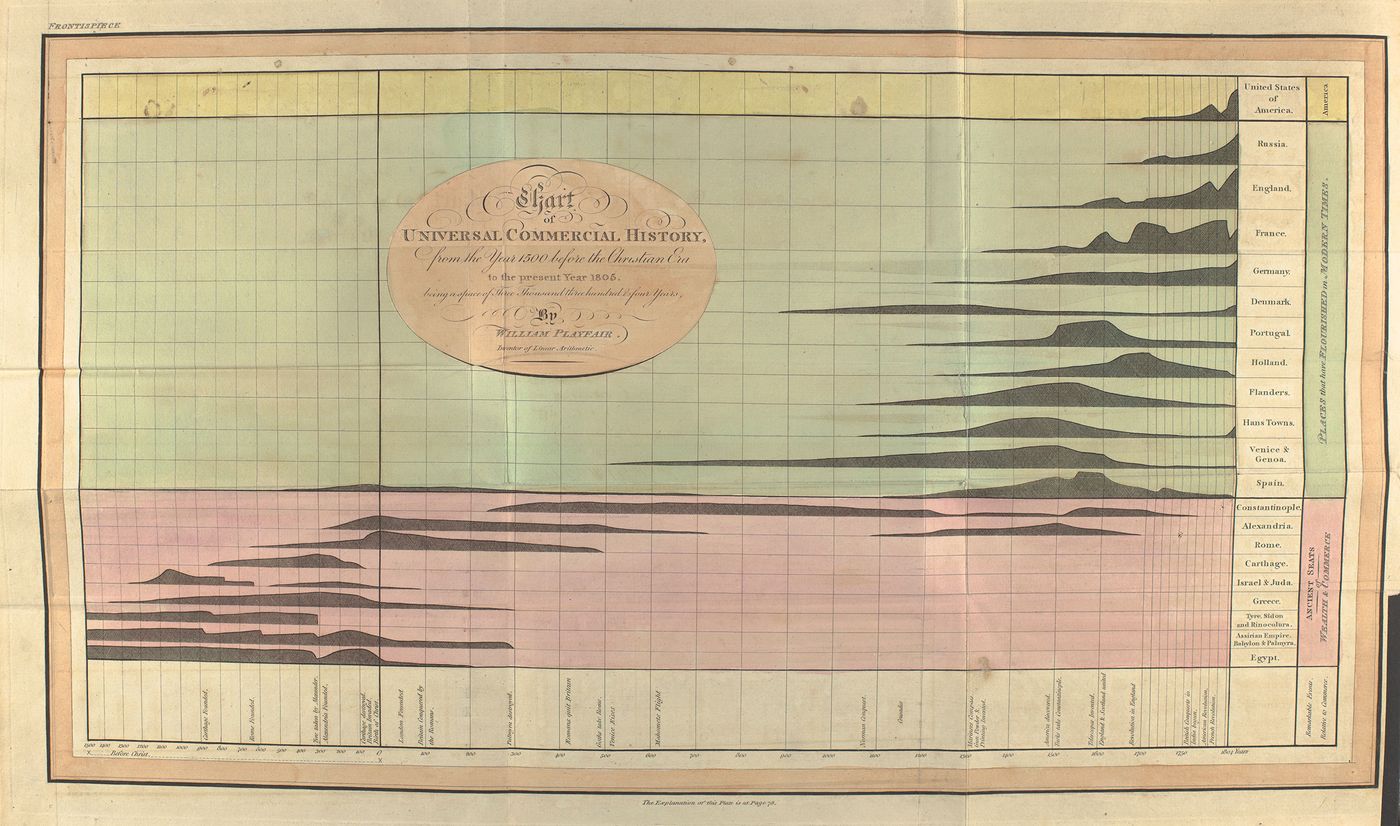
William Playfair. Universal commercial history from 1500 to 1805, 1805. Printed book. In William Playfair, An Inquiry into the Permanent Causes of the Decline and Fall of Powerful and Wealthy Nations (London: W. Marchant printer, 1805). STRONG ROOM OGDEN B 47, UCL Special Collections, London. UCL Special Collections, London.
Exhibition view of “Diagrams: A Project by AMO/OMA”, Fondazione Prada, Venice. Photography by Marco Cappelletti. Courtesy: Fondazione Prada.
